Tag Archives: sample preparation

Heavy Metals Testing: Methods, Strategies & Sampling

By Charles Deibel
3 Comments

Editor’s Note: The following is based on research and studies performed in their Santa Cruz Lab, with contributions from Mikhail Gadomski, Lab Manager, Ryan Maus Technical Services Analyst, Laurie Post, Director of Food Safety & Compliance, and Charles Deibel, President Deibel Cannabis Labs.


Heavy metals are common environmental contaminants resulting from human industrial activities such as mining operations, industrial waste, automotive emissions, coal fired power plants and farm/house hold water run-off. They affect the water and soil, and become concentrated in plants, animals, pesticides and the sediments used to make fertilizers. They can also be present in low quality glass or plastic packaging materials that can leach into the final cannabis product upon contact. The inputs used by cultivators that can be contaminated with heavy metals include fertilizers, growing media, air, water and even the clone/plant itself.

The four heavy metals tested in the cannabis industry are lead, arsenic, mercury and cadmium. The California Bureau of Cannabis Control (BCC) mandates heavy metals testing for all three categories of cannabis products (inhalable cannabis, inhalable cannabis products and other cannabis and cannabis products) starting December 31, 2018. On an ongoing basis, we recommend cultivators test for the regulated heavy metals in R&D samples any time there are changes in a growing process including changes to growing media, cannabis strains, a water system or source, packaging materials and fertilizers or pesticides. Cultivators should test the soil, nutrient medium, water and any new clones or plants for heavy metals. Pre-qualifying a new packaging material supplier or a water source prior to use is a proactive approach that could bypass issues with finished product.

Testing Strategies

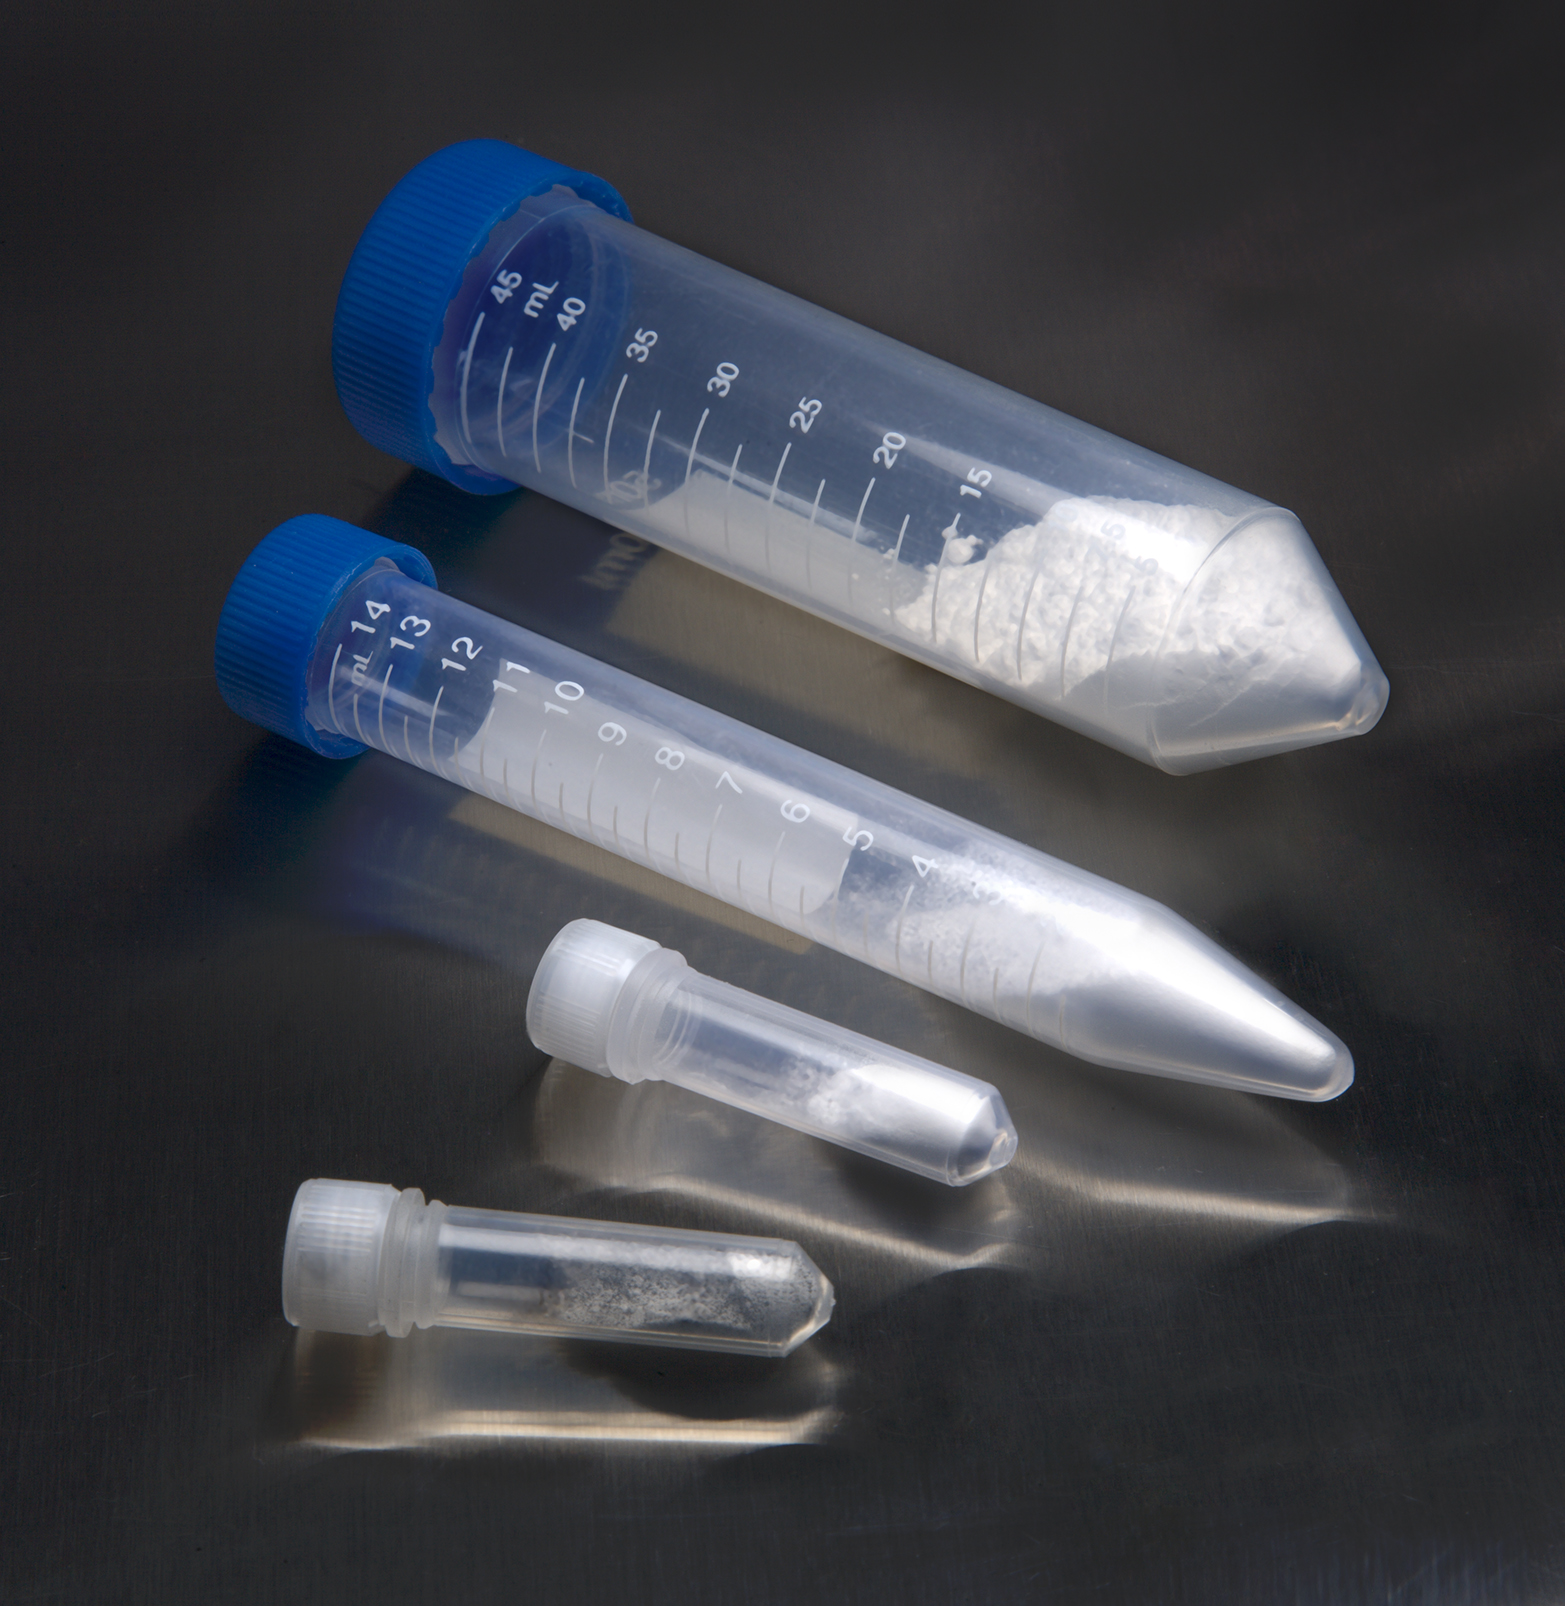
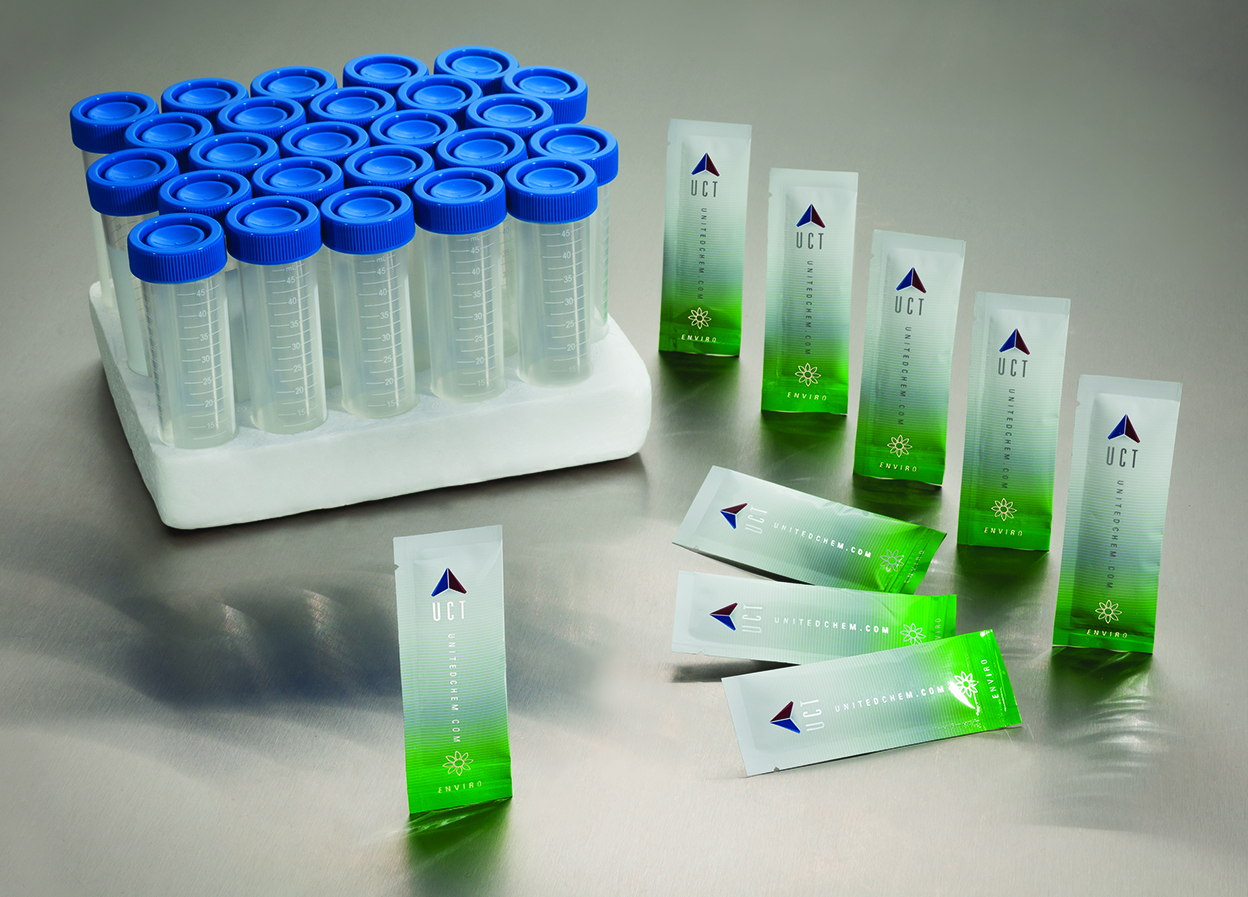
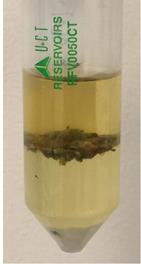
The best approach to heavy metal detection is the use of an instrument called an Inductively Coupled Plasma Mass Spectrometry (ICP-MS). There are many other instruments that can test for heavy metals, but in order to achieve the very low detection limits imposed by most states including California, the detector must be the ICP-MS. Prior to detection using ICP-MS, cannabis and cannabis related products go through a sample preparation stage consisting of some form of digestion to completely break down the complex matrix and extract the heavy metals for analysis. This two-step process is relatively fast and can be done in a single day, however, the instruments used to perform the digestion are usually the limiting step as the digesters run in a batch of 8-16 samples over a 2-hour period.

Only trace amounts of heavy metals are allowed by California’s BCC in cannabis and cannabis products. A highly sensitive detection system finds these trace amounts and also allows troubleshooting when a product is found to be out of specification.

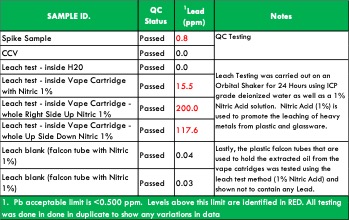
For example, during the course of testing, we have seen lead levels exceed the BCC’s allowable limit of 0.5 ppm in resin from plastic vape cartridges. An investigation determined that the plastic used to make the vape cartridge was the source of the excessive lead levels. Even if a concentrate passes the limits at the time of sampling, the concern is that over time, the lead leached from the plastic into the resin, increasing the concentration of heavy metals to unsafe levels.

Getting a Representative Sample

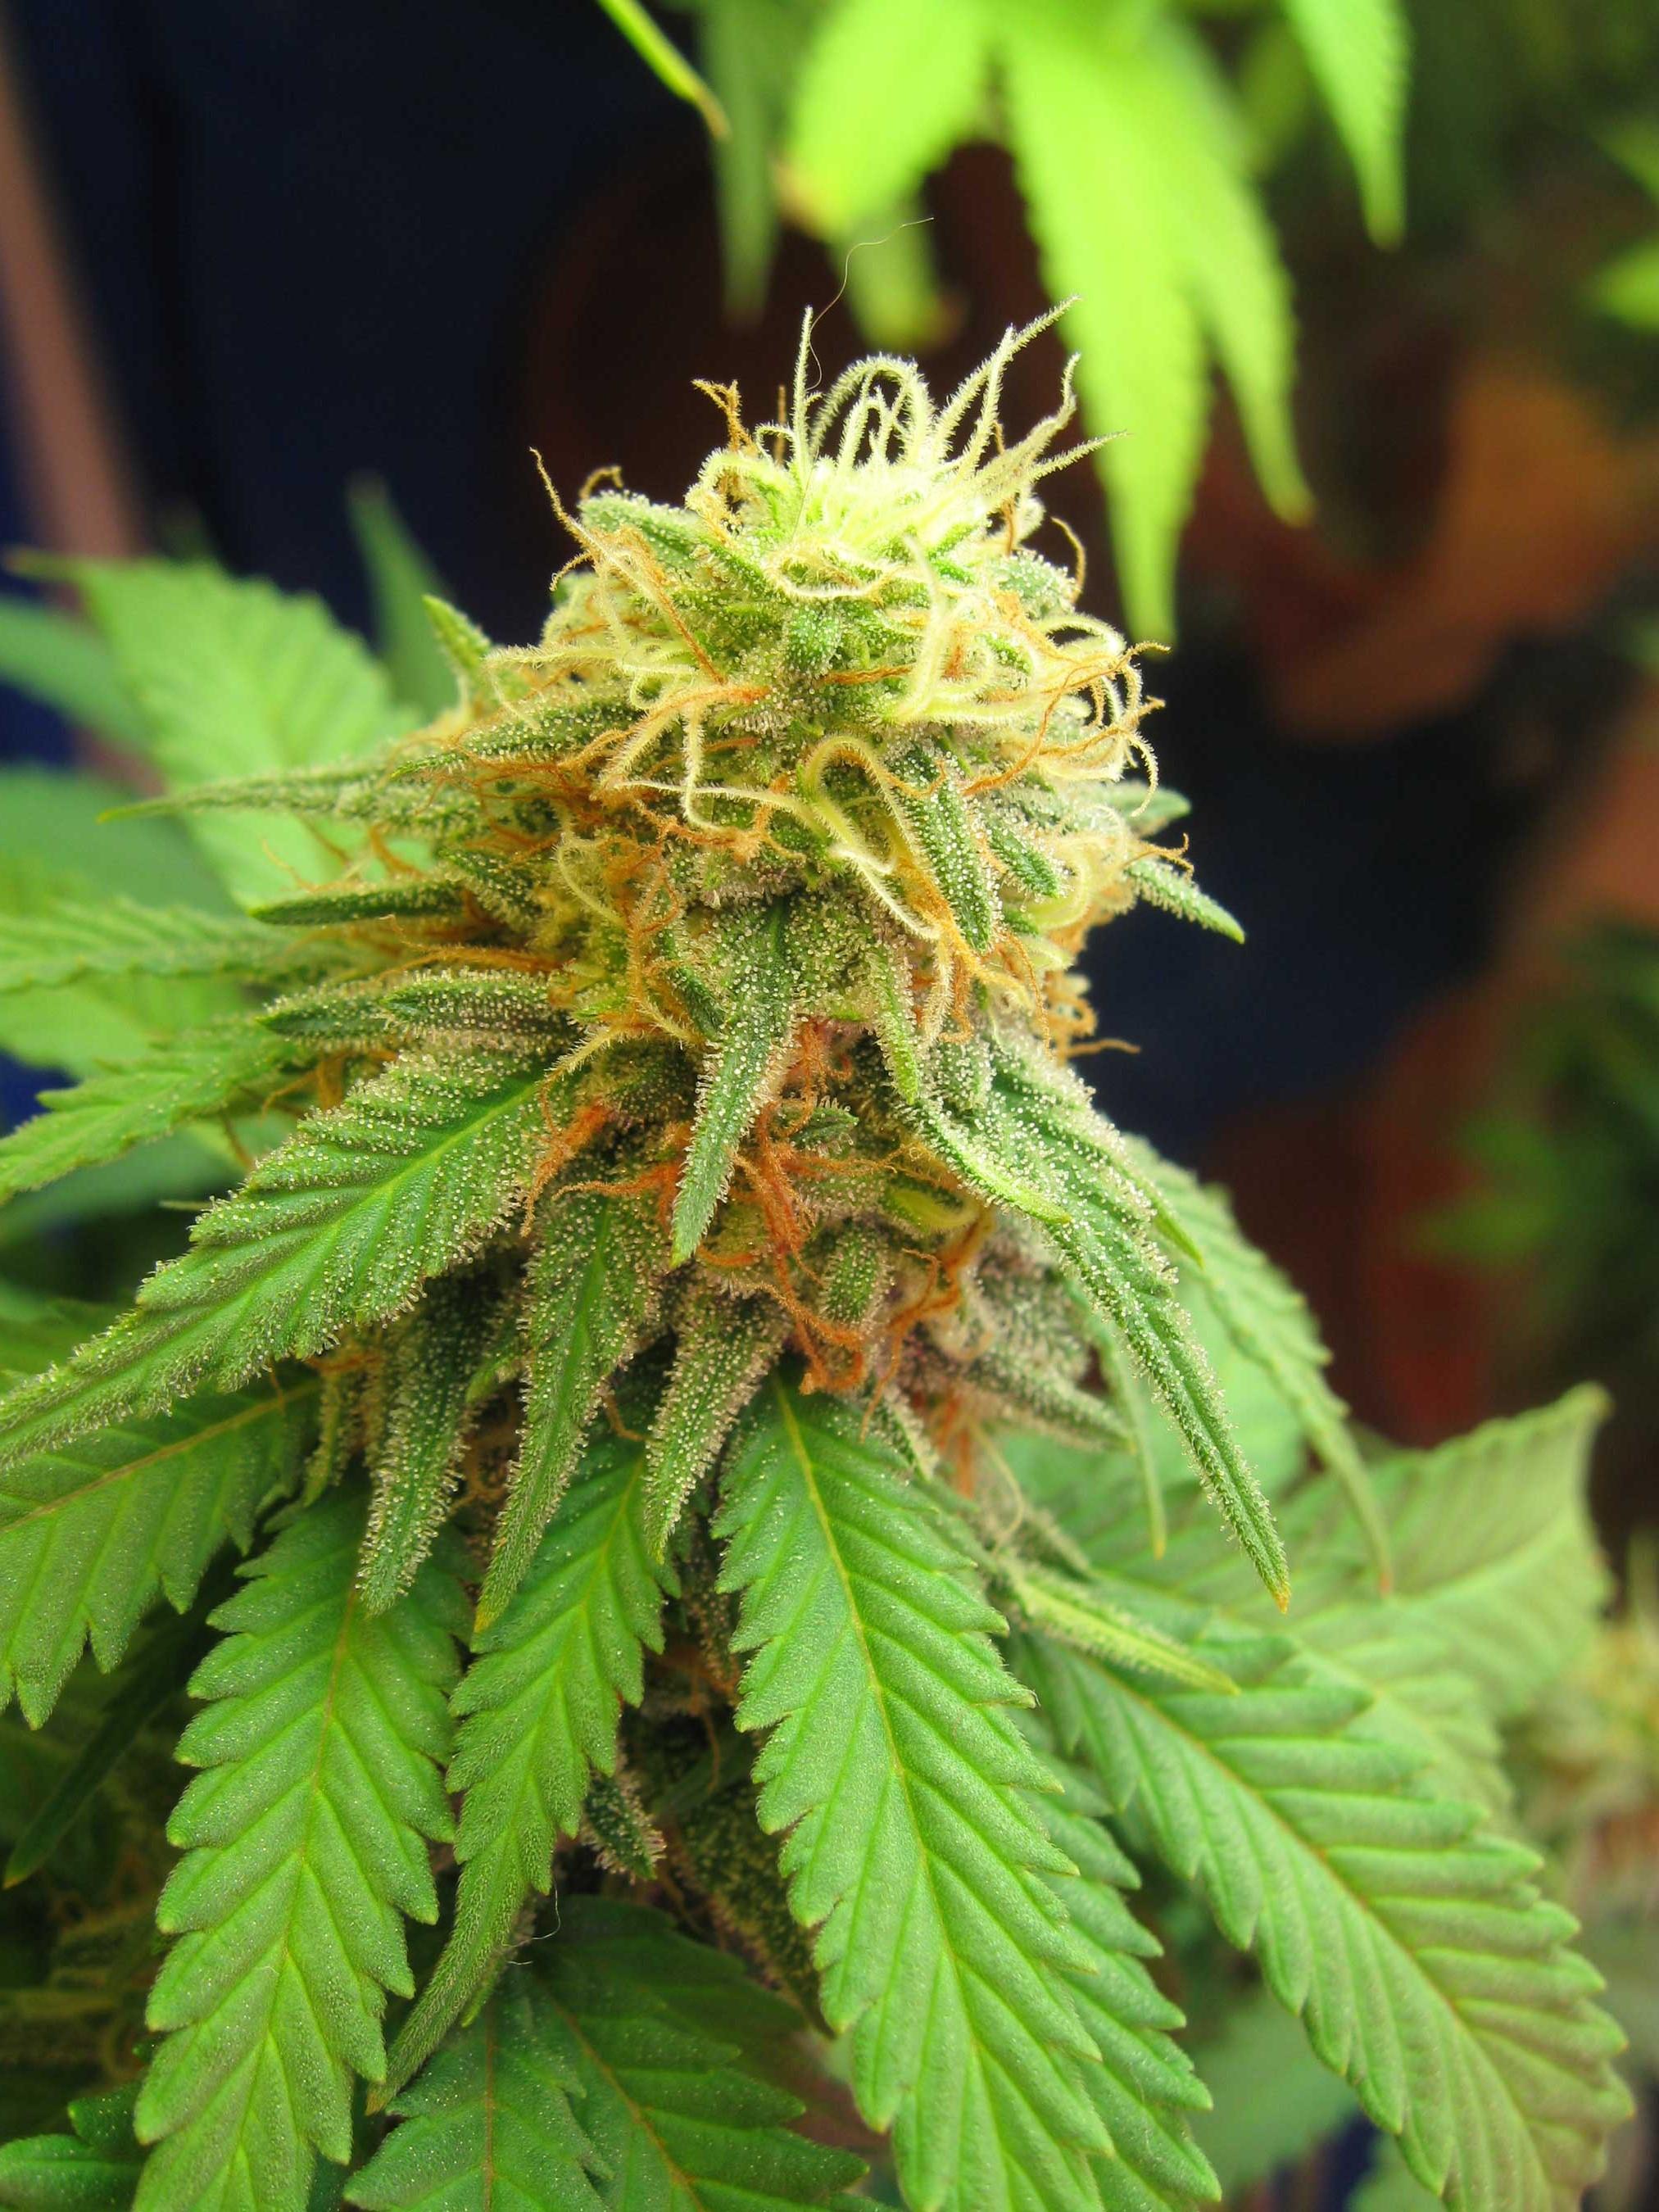
The ability to detect trace levels of heavy metals is based on the sample size and how well the sample represents the entire batch. The current California recommended amount of sample is 1 gram of product per batch.  Batch sizes can vary but cannot be larger than 50 pounds of flower. There is no upper limit to the batch sizes for other inhalable cannabis products (Category II).

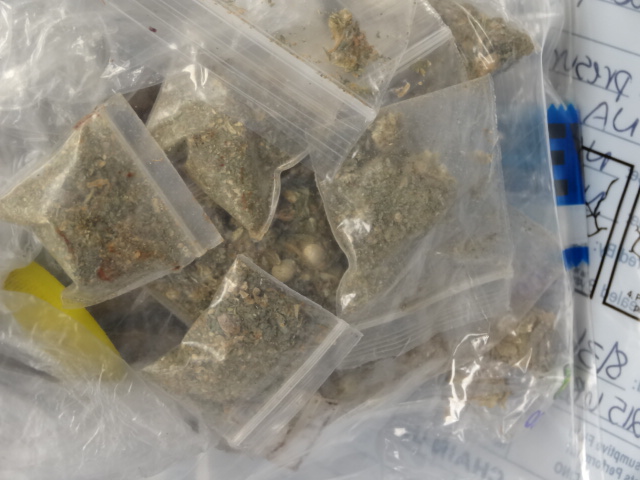
It is entirely likely that two different 1 gram samples of flower can have two different results for heavy metals because of how small a sample is collected compared to an entire batch. In addition, has the entire plant evenly collected and concentrated the heavy metals into every square inch of it’s leaves? No, probably not. In fact, preliminary research in leafy greens shows that heavy metals are not evenly distributed in a plant. Results from soil testing can also be inconsistent due to clumping or granularity. Heavy metals are not equally distributed within a lot of soil and the one small sample that is taken may not represent the entire batch. That is why it is imperative to take a “random” sample by collecting several smaller samples from different areas of the entire batch, combining them, and taking a 1 g sample from this composite for analysis.


References

California Cannabis CPA. 12/18/2018.  “What to Know About California’s Cannabis Testing Requirements”. https://www.californiacannabiscpa.com/blog/what-to-know-about-californias-cannabis-testing-requirements. Accessed January 10, 2019.

Citterio, S., A. Santagostino, P. Fumagalli, N. Prato, P. Ranalli and S. Sgorbati. 2003.  Heavy metal tolerance and accumulation of Cd, Cr and Ni by Cannabis sativa L.. Plant and Soil 256: 243–252.

Handwerk, B. 2015.  “Modern Marijuana Is Often Laced With Heavy Metals and Fungus.” Smithsonian.com. https://www.smithsonianmag.com/science-nature/modern-marijuana-more-potent-often-laced-heavy-metals-and-fungus-180954696/

Linger, P.  J. Mussig, H. Fischer, J. Kobert. 2002.  Industrial hemp (Cannabis sativa L.) growing on heavy metal contaminated soil: fibre quality and phytoremediation potential. Ind. Crops Prod. 11, 73–84.

McPartland, J. and K. J McKernan. 2017.  “Contaminants of Concern in Cannabis: Microbes, Heavy Metals and Pesticides”.  In: S. Chandra et al. (Eds.) Cannabis sativa L. – Botany and Biotechnology.  Springer International Publishing AG. P. 466-467.  https://www.researchgate.net/publication/318020615_Contaminants_of_Concern_in_Cannabis_Microbes_Heavy_Metals_and_Pesticides.  Accessed January 10, 2019.

Sidhu, G.P.S.  2016.  Heavy metal toxicity in soils: sources, remediation technologies and challenges.   Adv Plants AgricRes. 5(1):445‒446.

From The Lab

QuEChERS 101

By Danielle Mackowsky
No Comments

Sample preparation experts and analytical chemists are quick to suggest QuEChERS (Quick, Easy, Cheap, Effective, Rugged and Safe) to cannabis laboratories that are analyzing both flower and edible material for pesticides, mycotoxins and cannabinoid content. Besides having a quirky name, just what makes QuEChERS a good extraction technique for the complicated matrices of cannabis products? By understanding the chemistry behind the extraction and the methodology’s history, cannabis laboratories can better implement the technology and educate their workforce.

QuEChERS salt blends can be packed into mylar pouches for use with any type of centrifuge tubes

In 2003, a time when only eight states had legalized the use of medical cannabis, a group of four researchers published an article in the Journal of AOAC International that made quite the impact in the residue monitoring industry. Titled Fast and Easy Multiresidue Method Employing Acetonitrile Extraction/Partitioning and “Dispersive Solid-Phase Extraction” for the Determination of Pesticide Residues in Produce, Drs. Michael Anastassiades, Steven Lehotay, Darinka Štajnbaher and Frank Schenck demonstrate how hundreds of pesticides could be extracted from a variety of produce samples through the use of two sequential steps: an initial phase partitioning followed by an additional matrix clean up. In the paper’s conclusion, the term QuEChERS was officially coined. In the fourteen years that have followed, this article has been cited over 2800 times. Subsequent research publications have demonstrated its use in matrices beyond food products such as biological fluids, soil and dietary supplements for a plethora of analytes including phthalates, pharmaceutical compounds and most recently cannabis.

QuEChERS salts can come prepacked into centrifuge tubes

The original QuEChERS extraction method utilized a salt blend of 4 g of magnesium sulfate and 1 g of sodium chloride. A starting sample volume of 10 g and 10 mL of acetonitrile (ACN) were combined with the above-mentioned salt blend in a centrifuge tube. The second step, dispersive solid phase extraction (dSPE) cleanup, included 150 mg of magnesium sulfate and 25 mg of primary secondary amine (PSA). Subsequent extraction techniques, now known as AOAC and European QuEChERS, suggested the use of buffered salts in order to protect any base sensitive analytes that may be critical to one’s analysis. Though the pH of the extraction solvent may differ, all three methods agree that ACN should be used as the starting organic phase. ACN is capable of extracting the broadest range of analytes and is compatible with both LC-MS/MS and GC-MS systems. While ethyl acetate has also been suggested as a starting solvent, it is incompatible with LC-MS/MS and extracts a larger amount of undesirable matrix components in the final aliquot.

All laboratories, including cannabis and food safety settings, are constantly looking for ways to decrease their overhead costs, batch out the most samples possible per day, and keep their employees trained and safe. It is not a stretch to say that QuEChERS revolutionized the analytical industry and made the above goals tangible achievements. In the original publication, Anastassiades et al. established that recoveries of over 85% for pesticides residues were possible at a cost as low as $1 per ten grams of sample. Within forty minutes, up to twelve samples were fully extracted and ready to be analyzed by GC-MS, without the purchase of any specialized equipment. Most importantly, no halogenated solvents were necessary, making this an environmentally conscious concept. Due to the nature of the cannabis industry, laboratories in this field are able to decrease overall solvent usage by a greater amount than what was demonstrated in 2003. The recommended starting sample for cannabis laboratories is only one gram of flower, or a tenth of the starting volume that is commonly utilized in the food safety industry. This reduction in sample volume then leads to a reduction in acetonitrile usage and thus QuEChERS is a very green extraction methodology.

The complexity of the cannabis matrix can cause great extraction difficulties if proper techniques are not used

As with any analytical method, QuEChERS is not perfect or ideal for every laboratory setting. Challenges remain in the cannabis industry where the polarity of individual pesticides monitored in some states precludes them from being amenable to the QuEChERS approach. For cannabis laboratories looking to improve their pesticide recoveries, decrease their solvent usage and not invest their resources into additional bench top equipment, QuEChERS is an excellent technique to adopt. The commercialization of salt blends specific for cannabis flowers and edibles takes the guesswork out of which products to use. The growth of cannabis technical groups within established analytical organizations has allowed for better communication among scientists when it comes to best practices for this complicated matrix. Overall, it is definitely worth implementing the QuEChERS technique in one’s cannabis laboratory in order to streamline productivity without sacrificing your results.

The Practical Chemist

Pesticide Analysis in Cannabis and Related Products: Part 3

By Julie Kowalski
No Comments

As mentioned in Part 1, pesticides residue analysis is very challenging especially considering the complexity of cannabis and the variety of flower, concentrates and infused products. In addition, pesticides are tested at low levels typically at parts-per-billion (ppb). For example, the food safety industry often uses 10 ppb as a benchmark limit of quantification. To put that in perspective, current pesticides limits in cannabis range from 10 ppb default (Massachusetts Regulatory Limit) to a more typical range of 100 ppb to 2 ppm in other states. Current testing is also complicated by evolving regulations.

Despite these challenges, adaptation of methods used by the food safety industry have proved successful for testing pesticides in cannabis. These methods typically rely on mass spectrometric detection paired with sample preparation methods to render the sample clean enough to yield quality data.

Pesticide Analysis Methods: Sample preparation and Analytical Technique Strategy

Generally, methods can be divided into two parts; sample preparation and analytical testing where both are critical to the success of pesticide residue testing and are inextricably linked. Reliance on mass spectrometric techniques like tandem mass spectrometry and high resolution accurate mass (HRAM) mass spectrometry is attributed to the substantial sensitivity and selectivity provided. The sensitivity and selectivity achievable by the detector largely dictates the sample preparation that will be required. The more sensitive and selective the detector, the less rigorous and resource intensive sample preparation can be.

Analytical technique: Gas and Liquid Chromatography Tandem Mass Spectrometry 

The workhorse approach for pesticide residue analysis involves using gas chromatography and liquid chromatography tandem mass spectrometry (MS/MS) in the ion transition mode. This ion transition mode, often referred to as multiple reaction monitoring (MRM) or selected reaction monitoring (SRM), adds the selectivity and sensitivity needed for trace level analysis. Essentially, a pesticide precursor ion is fragmented into product ions. The detector monitors the signal for a specified product ion known to have originated from the pesticide precursor ion. This allows the signal to be corrected, associated with the analyte and not with other matrix components in the sample. In addition, because only ions meeting the precursor/product ion requirements are passed to the detector with little noise, there is a benefit to the observed signal to noise ratio allowing better sensitivity than in other modes. Even though ion transitions are specific, there is the possibility a matrix interference that also demonstrates that same ion transition could result in a false positive. Multiple ion transitions for each analyte are monitored to determine an ion ratio. The ion ratio should remain consistent for a specific analyte and is used to add confidence to analyte identification.

The best choice for pesticide analysis between gas chromatography (GC) and liquid chromatography (LC) is often questioned. To perform comprehensive pesticide screening similar to the way the food safety market approaches this challenge requires both techniques. It is not uncommon for screening methods to test for several hundred pesticides that vary in physiochemical properties. It may be possible that with a smaller list of analytes, only one technique will be needed but often in order to reach the low limits for pesticide residues both GC and LC are required.

Modified QuEChERS extraction using 1.5 grams of cannabis flower. Courtesy of Julie Kowalski (Restek Corporation), Jeff Dahl (Shimadzu Scientific Instruments) and Derek Laine (Trace Analytics).

Analytical technique: Sample Preparation

Less extensive sample preparation is possible when combined with sensitive and selective detectors like MS/MS. One popular method is the QuEChERS approach. QuEChERS stands for Quick, Easy, Cheap, Effective, Rugged and Safe. It consists of a solvent extraction/salting out step followed by a cleanup using dispersive solid phase extraction. Originally designed for fruit and vegetable pesticide testing, QuEChERS has been modified and used for many other commodity types including cannabis. Although QuEChERS is a viable method, sometimes more cleanup is needed and this can be done with cartridge solid phase extraction. This cleanup functions differently and is more labor intensive, but results in a cleaner extract. A cleaner extract helps to secure quality data and is sometimes needed for difficult analyses.

Annual AOCS Meeting Spotlights Cannabinoid Analytics

By Aaron G. Biros
No Comments

The AOCS Annual Meeting is an international science and business forum on fats, oils, surfactants, lipids and related materials. The American Oil Chemist’s Society (AOCS) is holding their meeting in Orlando, Florida from April 30 to May 3, 2017. Last year’s meeting included discussions on best practices and the pros and cons of different extraction techniques, sample preparation, proficiency testing and method development, among other topic areas.

Posters on display for the duration of the Annual Meeting will discuss innovative solutions to test, preparing samples, discovering new compounds and provide novel information about the compounds found in cannabis. David Egerton, vice president of technical operations at CW Analytical (a cannabis testing laboratory in Oakland, CA), is preparing a poster titled Endogenous Solvents in Cannabis Extracts. His abstract discusses testing regulations focusing on the detection of the presence of solvents, despite the fact that endogenous solvents, like acetone and lower alcohols, can be found in all plant material. His study will demonstrate the prevalence of those compounds in both the plant material and the concentrated oil without those compounds being used in production.rsz_am17-editorialpic-cij

The conference features more than 650 oral and poster presentations within 12 interest areas. This year’s technical program includes two sessions specifically designed to address cannabinoid analytics:

Lab Proficiency Programs and Reference Samples

How do you run a lab proficiency program when you cannot send your samples across state lines? What constituents do you test for when state requirements are all different? Are all pesticides illegal to use on cannabis? What pesticides should be tested for when they are mostly illegal to use? How do you analyze proficiency results when there are no standard methods? Learn about these and other challenges facing the cannabis industry. This session encourages open and active discussion, as the cannabis experts want to hear from you and learn about your experiences.

Method Development

The need for high-quality and safe products has spurred a new interest in cannabinoid analytics, including sample preparation, pesticide, and other constituent testing. In this session, a diverse group of scientists will discuss developing analytical methods to investigate cannabis. Learn the latest in finding and identifying terpenes, cannabinoids, matrix effects, and even the best practice for dissolving a gummy bear.

Cynthia Ludwig speaking at last year's meeting
Cynthia Ludwig speaking at last year’s meeting

Cynthia Ludwig, director of technical services at AOCS, says they are making great progress in assembling analytical methods for the production of the book AOCS Collection of Cannabis Analytical Methods. “We are the leading organization supporting the development of analytical methods in the cannabis industry,” says Ludwig. “Many of the contributors in that collection will be presenting at the AOCS Annual Meeting, highlighting some of the latest advances in analyzing cannabis.” The organization hopes to foster more collaboration among those in the cannabis testing industry.

In addition to oral and poster sessions, the 2017 Annual Meeting will feature daily networking activities, more than 70 international exhibitors, two special sessions, and a Hot Topics Symposia which will address how current, critical issues impact the future of the fats and oils industry.

amandarigdon
The Practical Chemist

Calibration Part II – Evaluating Your Curves

By Amanda Rigdon
No Comments
amandarigdon

Despite the title, this article is not about weight loss – it is about generating valid analytical data for quantitative analyses. In the last installment of The Practical Chemist, I introduced instrument calibration and covered a few ways we can calibrate our instruments. Just because we have run several standards across a range of concentrations and plotted a curve using the resulting data, it does not mean our curve accurately represents our instrument’s response across that concentration range. In order to be able to claim that our calibration curve accurately represents our instrument response, we have to take a look at a couple of quality indicators for our curve data:

  1. correlation coefficient (r) or coefficient of determination (r2)
  2. back-calculated accuracy (reported as % error)

The r or r2 values that accompany our calibration curve are measurements of how closely our curve matches the data we have generated. The closer the values are to 1.00, the more accurately our curve represents our detector response. Generally, r values ≥0.995 and r2 values ≥ 0.990 are considered ‘good’. Figure 1 shows a few representative curves, their associated data, and r2 values (concentration and response units are arbitrary).

Figure 1: Representative Curves and r2 values

Let’s take a closer look at these curves:

Curve A: This represents a case where the curve perfectly matches the instrument data, meaning our calculated unknown values will be accurate across the entire calibration range.

Curve B: The r2 value is good and visually the curve matches most of the data points pretty well. However, if we look at our two highest calibration points, we can see that they do not match the trend for the rest of the data; the response values should be closer to 1250 and 2500. The fact that they are much lower than they should be could indicate that we are starting to overload our detector at higher calibration levels; we are putting more mass of analyte into the detector than it can reliably detect. This is a common problem when dealing with concentrated samples, so it can occur especially for potency analyses.

Curve C: We can see that although our r2 value is still okay, we are not detecting analytes as we should at the low end of our curve. In fact, at our lowest calibration level, the instrument is not detecting anything at all (0 response at the lowest point). This is a common problem with residual solvent and pesticide analyses where detection levels for some compounds like benzene are very low.

Curve D: It is a perfect example of our curve not representing our instrument response at all. A curve like this indicates a possible problem with the instrument or sample preparation.

So even if our curve looks good, we could be generating inaccurate results for some samples. This brings us to another measure of curve fitness: back-calculated accuracy (expressed as % error). This is an easy way to determine how accurate your results will be without performing a single additional run.

Back-calculated accuracy simply plugs the area values we obtained from our calibrators back into the calibration curve to see how well our curve will calculate these values in relation to the known value. We can do this by reprocessing our calibrators as unknowns or by hand. As an example, let’s back-calculate the concentration of our 500 level calibrator from Curve B. The formula for that curve is: y = 3.543x + 52.805. If we plug 1800 in for y and solve for x, we end up with a calculated concentration of 493. To calculate the error of our calculated value versus the true value, we can use the equation: % Error = [(calculated value – true value)/true value] * 100. This gives us a % error of -1.4%. Acceptable % error values are usually ±15 – 20% depending on analysis type. Let’s see what the % error values are for the curves shown in Figure 1.

practical chemist table 1
Table 1: % Error for Back-Calculated Values for Curves A – D

Our % error values have told us what our r2 values could not. We knew Curve D was unacceptable, but now we can see that Curves B and C will yield inaccurate results for all but the highest levels of analyte – even though the results were skewed at opposite ends of the curves.

There are many more details regarding generating calibration curves and measuring their quality that I did not have room to mention here. Hopefully, these two articles have given you some tools to use in your lab to quickly and easily improve the quality of your data. If you would like to learn more about this topic or have any questions, please don’t hesitate to contact me at amanda.rigdon@restek.com.

UCT-Dspe

Pesticide & Potency Analysis of Street-Grade versus Medicinal Cannabis

By Danielle Mackowsky
2 Comments
UCT-Dspe

In states where cannabis is legalized, some analytical laboratories are tasked with identifying and quantifying pesticide content in plant material. This is a relatively new concept in the study of cannabis as most forensic laboratories that work with seized plant material are only concerned with positively identifying the sample as cannabis. Laboratories of this nature, often associated with police departments, the office of the chief medical examiner or the local department of public health are not required to identify the amount of THC and other cannabinoids in the plant. While data is abundant that compares the average THC content in today’s recreational cannabis to that commonly consumed in the 1960s and 1970s, limited scientific studies can be found that discuss the pesticide content in street-grade cannabis.

cannabis-siezed
Street-grade cannabis that is ground into a fine powder

Using the QuEChERS approach, which is the industry gold-standard in food analysis for pesticides, a comparison study was carried out to analyze the pesticide and cannabinoid content in street-grade cannabis versus medicinal cannabis. For all samples, one gram of plant material was ground into a fine powder prior to hydration with methanol. The sample was then ready to be placed into an extraction tube, along with 10 mL of acetonitrile and one pouch of QuEChERS salts. After a quick vortex, all samples were then shaken for 1 minute using a SPEX Geno/Grinder prior to centrifugation.

Quenchers-analysis
Formation of layers following QuEChERS extraction

For pesticide analysis, a one mL aliquot of the top organic layer was then subjected to additional dispersive solid phase extraction (dSPE) clean-up. The blend of dSPE salts was selected to optimize the removal of chlorophyll and other interfering compounds from the plant material without compromising the recovery of any planar pesticides. Shaken and centrifuged under the same conditions as described above, an aliquot of the organic layer was then transferred to an auto-sampler vial and diluted with deionized water. Cannabinoid analysis required serial dilutions between 200 to 2000 times, depending on the individual sample. Both pesticide and cannabinoid separation was carried out on a UCT Selectra® Aqueous C18 HPLC column and guard column coupled to a Thermo Scientific Dionex UltiMate 3000 LC System/ TSQ VantageTM tandem MS.

UCT-Dspe
Supernatant before and after additional dispersive SPE clean-up using UCT’s Chlorofiltr

Pesticide Results

Due to inconsistent regulations among states that have legalized medicinal or recreational cannabis, a wide panel of commonly encountered pesticides was selected for this application. DEET, recognized by the EPA as not evoking health concerns to the general public when applied topically, was found on all medical cannabis samples tested. An average of 28 ng/g of DEET was found on medicinal samples analyzed. Limited research as to possible side effects, if any, of having this pesticide present within volatilized medical-grade product is available. Street-grade cannabis was found to have a variety of pesticides at concentrations higher than what was observed in the medical-grade product.

Potency Results

Tetrahydrocannabinolic acid A (THCA-A) is the non-psychoactive precursor to THC. Within fresh plant material, up to 90% of available THC is found in this form. Under intense heating such as when cannabis is smoked, THCA-A is progressively decarboxylated to the psychoactive THC form. Due to possible therapeutic qualities of this compound, medical cannabis samples specifically were tested for this analyte in addition to other cannabinoids. On average, 17% of the total weight in each medical cannabis sample came from the presence of THCA-A. In both medical and recreational samples, the percentage of THC contribution ranged from 0.9-1.7.

Summary

A fast and effective method was developed for the determination of pesticide residues and cannabis potency in recreational and medical cannabis samples. Pesticide residues and cannabinoids were extracted using the UCT QuEChERS approach, followed by either additional cleanup using a blend of dSPE sorbents for pesticide analysis, or serial dilutions for cannabinoid potency testing.

TeganAdams_Eurofinsexperchem
Quality From Canada

Following a Cannabis Sample Through the Lab: 9 Important Steps

By Tegan Adams
No Comments
TeganAdams_Eurofinsexperchem

Anytime a cannabis sample enters a laboratory, the sample is received, handled, weighed, identified and traced throughout the testing and disposal process. Laboratories working with cannabis must have quality systems in place to ensure every action taken to test the cannabis sample is documented and in compliance with good manufacturing practices. Eurofins-Experchem’s sample receipt and handling SOPs includes the following key elements.

  1. Purpose: The purpose of the SOP is outlined to make sure it’s outcome is understood
  2. Scope: The Scope of the SOP explains what events the SOP is intended to avoid and which events the SOP is intended to encourage
  3. Responsibilities: All positions that the SOP affects are outlined
  4. Initial Receipt of the Sample: Samples are submitted to Eurofins Experchem Laboratories with a Sample Information Form. In Canada, cannabis is regulated as a controlled substance. Controlled substances come with a special shipping document and must be weighed upon receipt to the lab to make sure the weight is the same as the client has indicated. Cannabis samples received are inspected to ensure no tampering or damage has occurred to the sample before it is tested. Any temperature and/or storage requirements are noted and followed. If any conditions are not understood the client is contacted for clarification immediately. Pending the sample’s conditions are met, the sample is placed into the laboratory.
  5. Procedure: Eurofins Experchem uses its own sample tracking software to track a sample across the lab. A unique project number and date of entry is given to the sample.  Client name, product name, condition of sample, test(s) performed, ID or lot number and size of samples are all recorded. A sticker is attached to the sample to clarify.
  6. Rush Samples: Rush samples are stamped “RUSH” in red and are placed in a priority sequence. The sample is placed in the safe until required for testing. If the product is not cannabis, the sample is placed on a shelf corresponding with the actual day of the month it was received and entered into sample tracking. If the sample requires cold temperatures it is placed in a refrigerated area and monitored in a similar way.
  7. Discrepancies: Any discrepancies in information found on the sample that may differentiate from what the client requests will be communicated to the client upon finding.
  8. Controlled Documents: Stickers, original lab specification sheets, sample submission forms, and SOP training evaluation questionnaires.
  9. Results: As soon as testing is completed, lab results are approved by quality assurance reviewers. A Certificate of Analysis (COA) is electronically and automatically sent through the sample tracking system to the client’s email.