In a press release published this week, AOAC International announced it has partnered with Signature Science, LLC as the test material provider for the new AOAC Cannabis/Hemp Proficiency Testing program. What makes this proficiency testing (PT) program so unique is that AOAC will be the only PT provider to offer actual cannabis flower as the matrix.
This month, the pilot round with twenty cannabis testing labs begins with hemp-only samples being shipped in early May. The first live round of the PT program is scheduled for November of this year and will offer participating labs the choice of cannabis flower samples or hemp samples.
The program will include one sample for cannabinoid and terpene profiles, moisture and heavy metals, as well as a second sample for pesticide residue testing. According to the press release, mycotoxins will be added to the mix soon.
The new PT program was developed by stakeholders involved with the AOAC Cannabis Analytical Science Program (CASP), including state regulatory labs, industry labs, state and federal agencies and accreditation bodies. Shane Flynn, senior director of AOAC’s PT program, says the program is a result of scientists coming to them with concerns about testing in the cannabis space. “AOAC has a long history of bringing scientists together to address emerging topics, so when stakeholders came to AOAC with their concerns and need for quality proficiency testing in the cannabis industry, AOAC acted,” says Flynn. “Stakeholders noted the analytical differences in testing cannabis versus hemp and had specific concerns around it and asked for a program that would provide actual cannabis samples in addition to hemp. This is truly a program that was created by the stakeholders, for the stakeholders.”
AOAC says they plan on introducing microbiology to the PT program, with microbial contamination tests in both cannabis and hemp samples. They are also considering adding additional matrices, like chocolate and gummies.
Signature Science is an ISO 17043 accredited proficiency test provider that also has a DEA-licensed controlled substances lab, making them an ideal candidate to partner with AOAC for the PT Program. They entered into a 3-year MoU with AOAC for the program. Their team developed and validated methods used to create the samples for the PT program at their DEA-licensed lab in Austin, Texas.
By Kelsey Cagle, Frank L. Dorman, Jessica Westland No Comments
Sample preparation is an essential part of method development and is critical to successful analytical determinations. With cannabis and cannabis products, the analyst is faced with a very challenging matrix and targets that may range from trace level through percent level thus placing considerable demands on the sample preparation techniques.1 The optimal sample preparation, or “extraction”, method for potency analysis of cannabis flower was determined using a methanol extraction coupled with filtration using regenerated cellulose filters.
In the United States (US), Canada, and other countries where medicinal and/or adult recreational cannabis has been legalized, regulatory entities require a panel of chemical tests to ensure quality and safety of the products prior to retail sales2. Cannabis testing can be divided into two different categories: Quality and Safety. Quality testing, which includes potency analysis (also known as cannabinoid testing or cannabinoid content), is performed to analyze the product in accordance with the producer/grower expectations and government regulations. Safety testing is conducted under regulatory guidelines to ensure that consumers are not exposed to toxicants such as pesticides, mycotoxins, heavy metals, residual solvents and microbial contaminates.
Potency testing evaluates the total amount of cannabinoid content, specifically focusing on tetrahydrocannabinol (THC) and cannabidiol (CBD). In the US, the biggest push for accurate total THC is to differentiate between hemp (legally grown for industrial or medicinal use), which is defined as cannabis sativa with a THC limit ≤ 0.3 %, and cannabis (Cannabis spp.), which is any cannabis plant with THC measured above 0.3 %3. Potency testing is typically performed by liquid chromatography (LC) with UV detection to determine the quantity of major cannabinoids.
In addition to reporting THC and CBD, their respective precursors are also important for reporting total potency. Tetrahydrocannabinolic acid (THCA) is the inactive precursor to THC while cannabidiolic acid (CBDA) is the precursor to CBD.4,5
Methods and Materials
Sample Preparation
All samples were homogenized using an immersion blender with a dry material grinder. The nominal sample amounts were 200 mg of flower, 500 mg of edibles, and 250 mg of candy samples.
Potency Extraction Method (1)
Twenty milliliters (mL) of methanol (MeOH) was added to each sample. The samples were mechanically shaken for 10 minutes and centrifuged for 5 minutes.
Potency Extraction Method (2)
Ten mL of water was added to each sample. The samples were mechanically shaken for 10 minutes. 20 mL of acetonitrile (ACN) was then added to each sample and vortexed. An EN QuEChERS extraction salt packet was added to the sample. The samples were placed on a mechanical shaker for 2 minutes and then centrifuged for 5 minutes.
Each extract was split and evaluated with two filtration/cleanup steps: (1) a regenerated cellulose (RC) syringe filter (Agilent Technologies, 4 mm, 0.45 µm); (2) a PFTE syringe filter (Agilent Technologies, 4 mm, 0.45 µm). The final filtered extracts were injected into the ultra-performance liquid chromatograph coupled with a photodiode array detector (UPLC-PDA) for analysis.
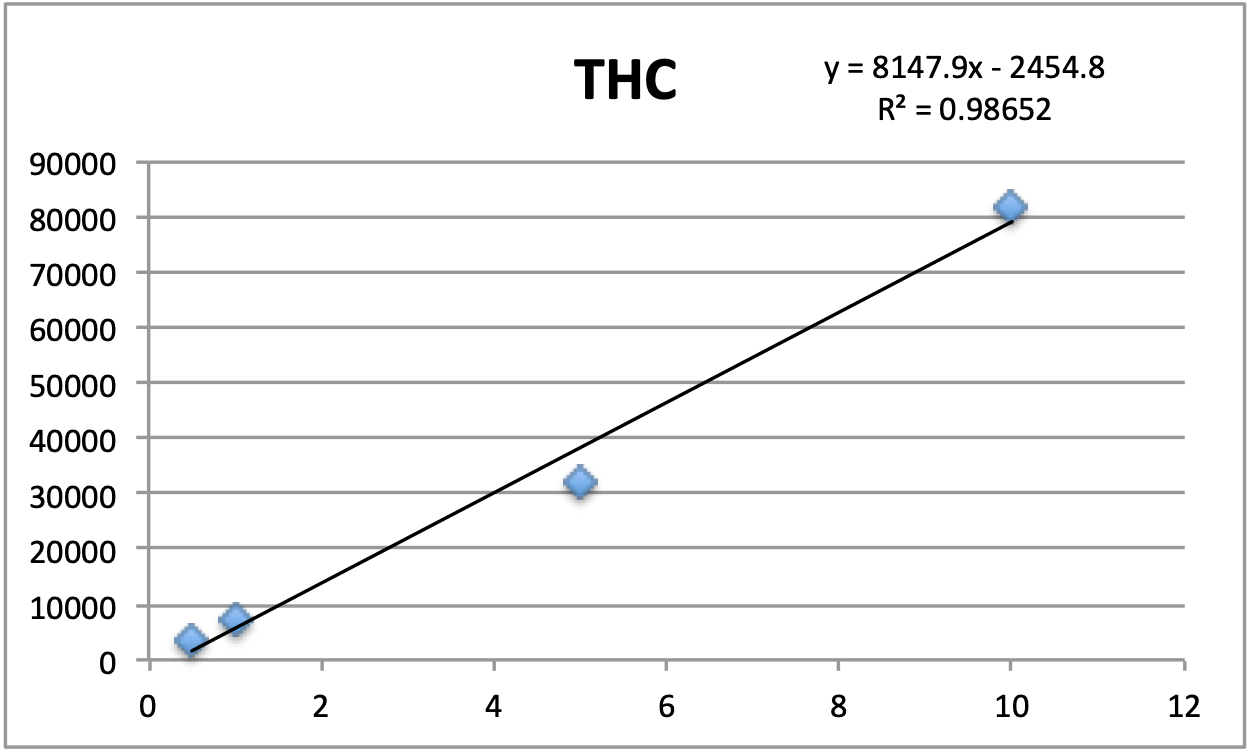
Figure 1: Calibration curve for THC potency
Calibration
Standards were obtained for the following cannabinoids at a concentration of 1 mg/mL: cannabidivarin (CBDV), tetrahydrocannabivarin (THCV), cannabidiol (CBD), cannabigerol (CBG), cannabidiolic acid (CBDA), cannabigerolic acid (CBGA), cannabinol (CBN), tetrahydrocannabinol (9-THC), cannabichromene (CBC), tetrahydrocannabinol acid (THCA). Equal volumes of each standard were mixed with MeOH to make a standard stock solution of 10 ug/mL. Serial dilutions were made from the stock to make concentrations of 5, 1, and 0.5 ug/mL for the calibration curve (Figure 1).
Instrumental Method
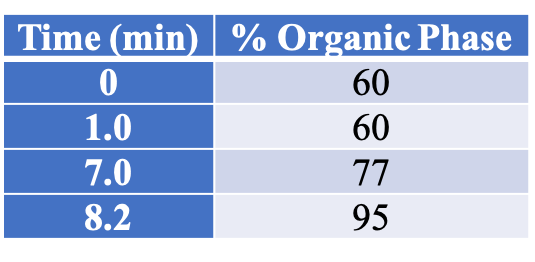
All instrument parameters were followed from Agilent Application Note 5991-9285EN.8 A UPLC with a PDA (Waters Corp, Milford, MA) detector was employed for potency analysis. An InfinityLab Poroshell 120 EC-C18, 3.0 x 50 mm, 2.7 um column (Agilent Technologies, Wilmington, DE) was utilized for compound separation. The organic mobile phase composition was 0.05 % (v/v) formic acid in HPLC grade MeOH and the aqueous mobile phase composition was 0.1 % (v/v) formic acid in HPLC grade water. The mobile phase gradient is shown in Table 1. The flow rate was 1 mL/min (9.5 minute total program), injection volume was 5 uL, and column temperature was 50 °C.
Table 1: LC mobile phase gradient for potency samples6
Discussion and Results
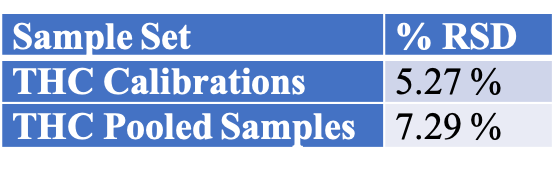
Table 2 summarizes the relative standard deviations (% RSD) were found for the THC calibrator (at 1 ug/mL) and one extract of a homogeneous sample (utilizing 7 replicates).
Table 2- %RSD values for the instrument response precision for THC in both the calibrations and the homogeneous extract.
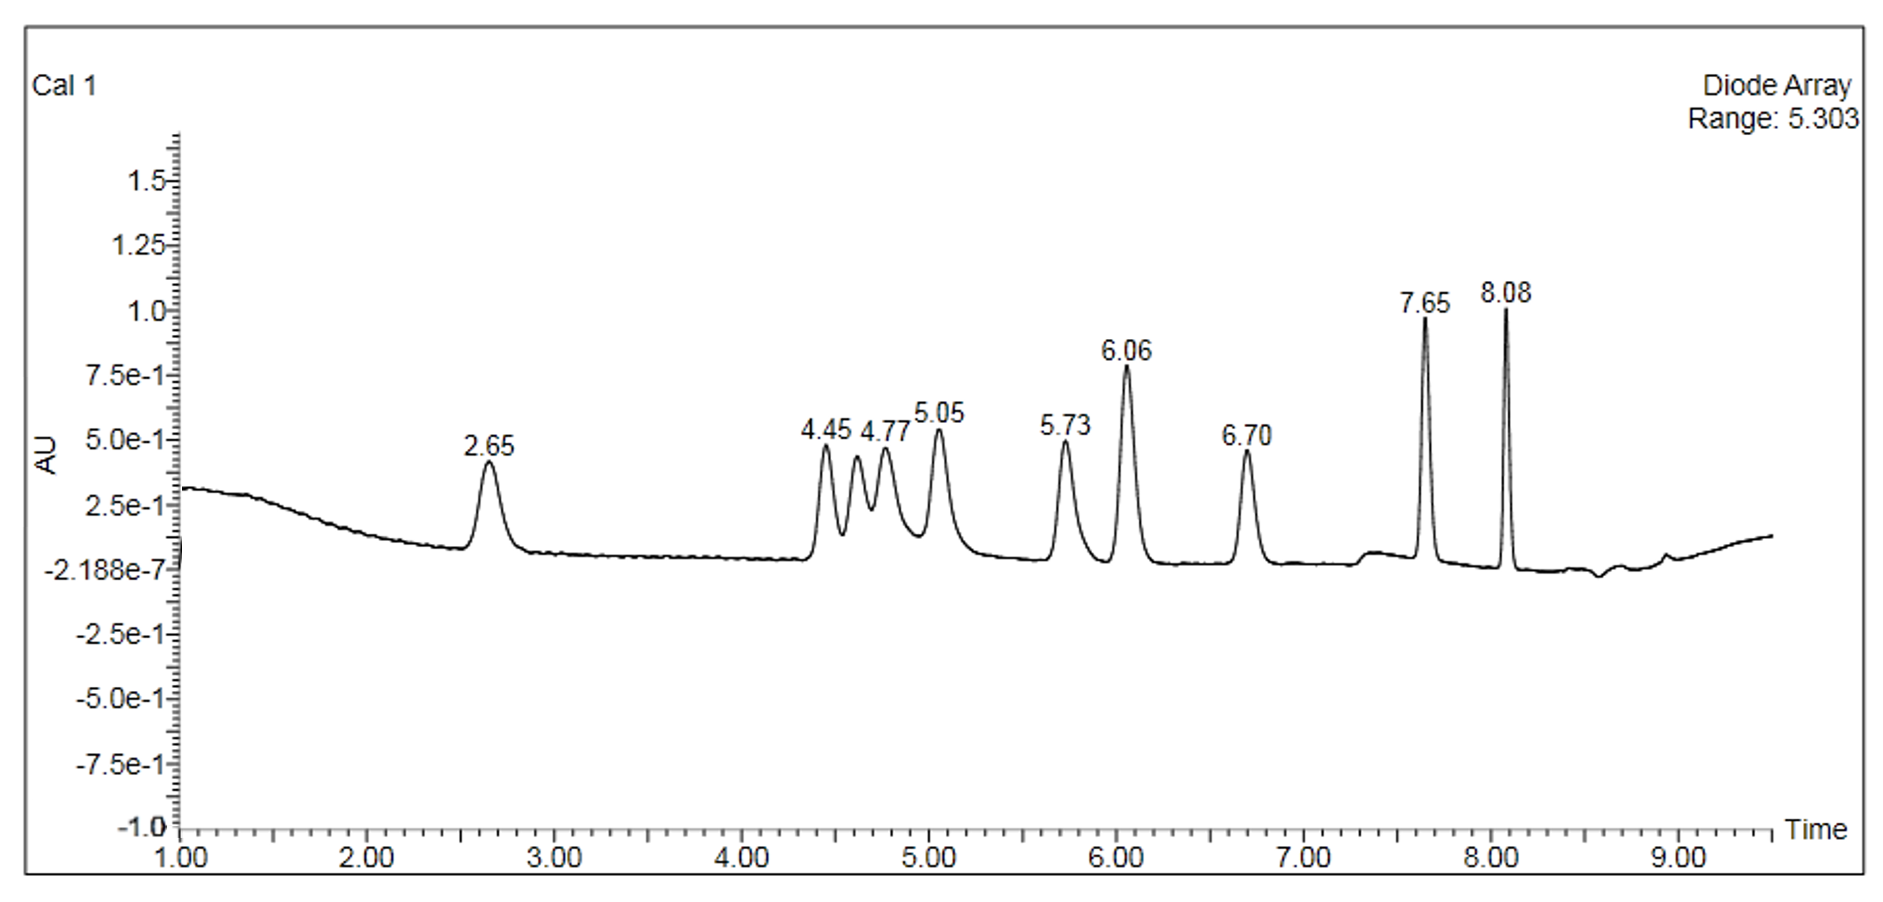
The cannabinoid potency of various cannabis plant and cannabis product samples were determined for the various extraction techniques In the chromatograms THC was observed ~8.08 minutes and CBD was observed ~4.61 minutes (Figure 2).
Figure 2: Chromatogram of the 10ug/mL calibrator for potency/cannabinoid analysis
Total potency for THC & CBD were calculated for each sample using the equations below. Equation 1 was used because it accounts for the presence of THCA as well as the specific weight difference between THC and THCA (since THCA will eventually convert to THC, this needs to be accounted for in the calculations).
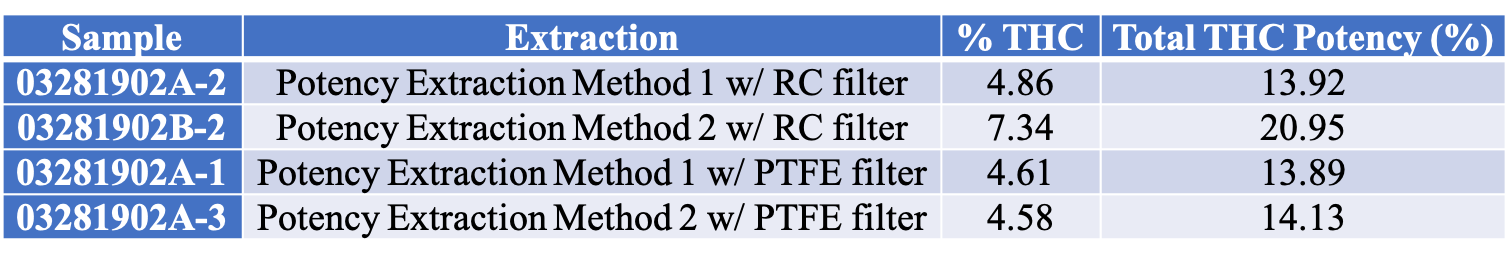
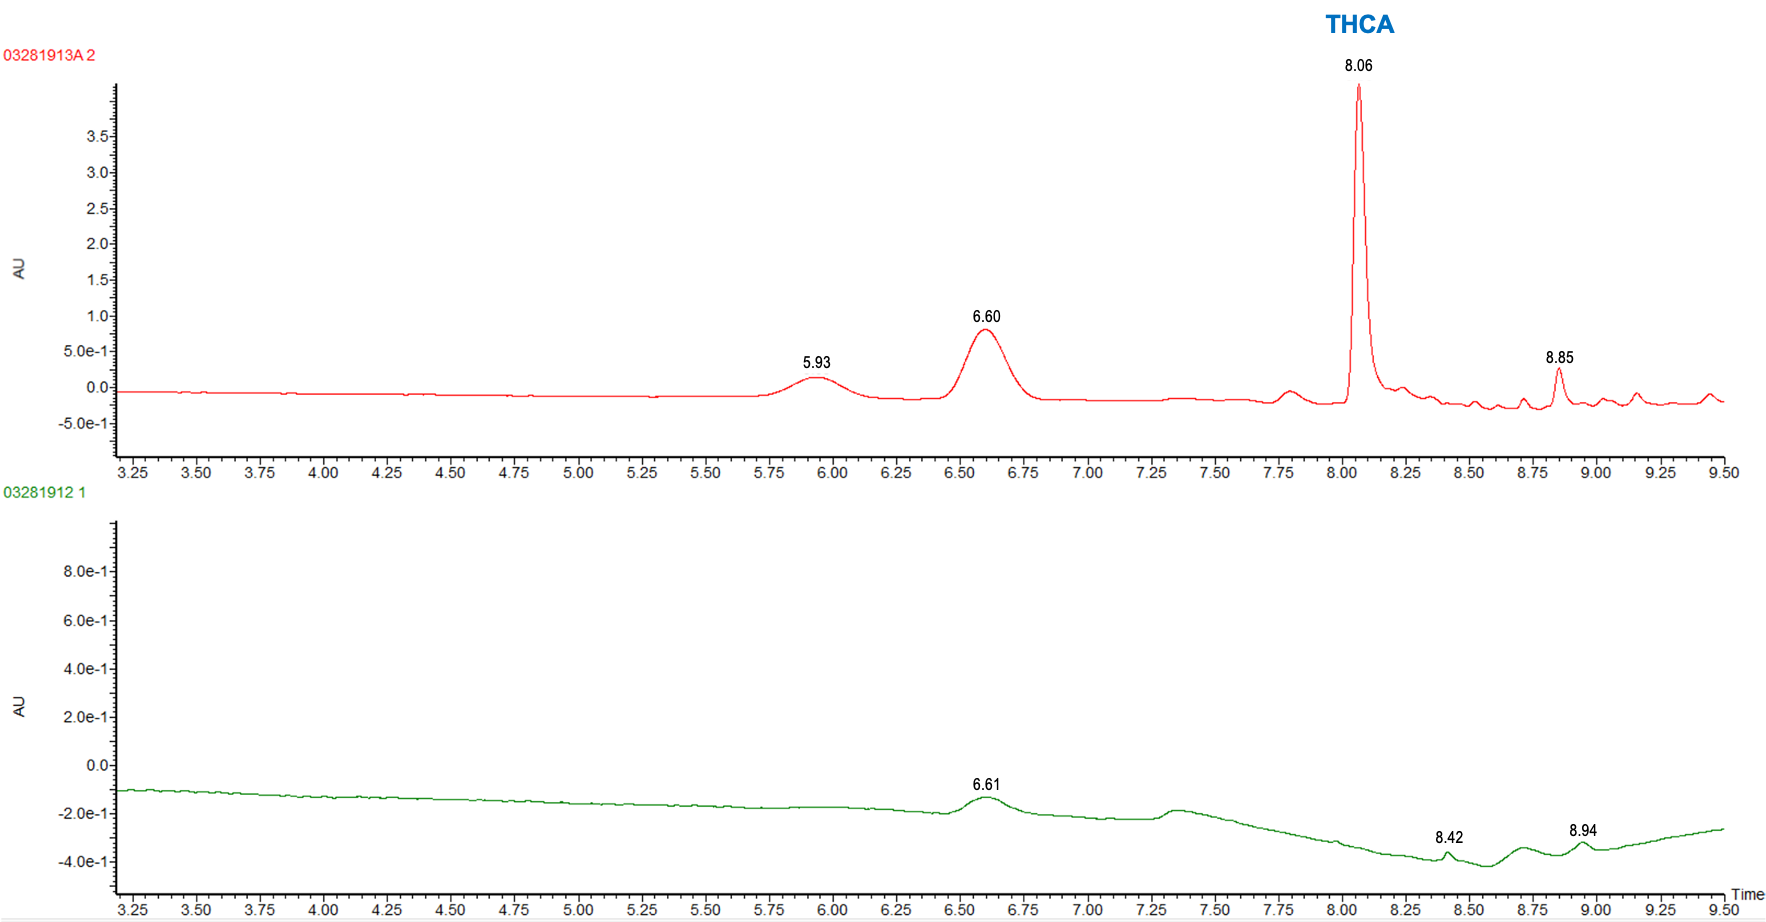
Table 3 shows the % THC and the total THC potency values calculated for the same flower samples that went through all four various potency sample preparation techniques as described earlier. Figure 3 also provides LC chromatograms for flower sample 03281913A-2 and edible sample 03281912-1.
Table 3-THC and Total THC potency values for the same cannabis flower sample processed through the combination of extractions and cleanups.Figure 3: Potency/Cannabinoid analysis chromatogram for flower sample 03281913A-2 (red trace) and edible sample 03281912-1 (green trace).
The results indicated that with the “Potency Extraction Method 2” (ACN/QuEChERS extraction) coupled with the RC filter provided a bias of 7.29 % greater for total THC % over the other extraction techniques. Since the other 3 techniques provided total THC values within 2% of each other, the total THC of the sample is more likely ~14%.
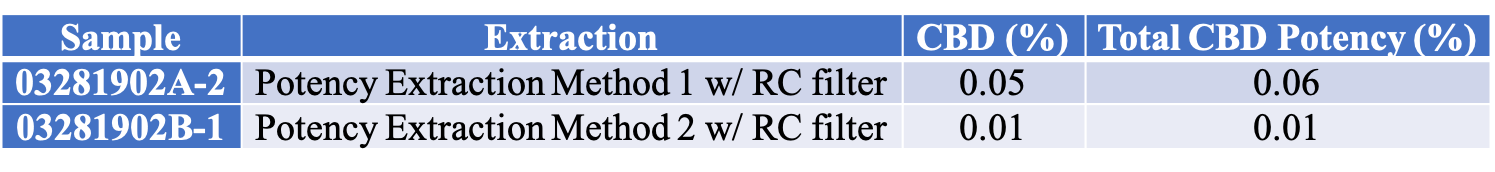
Since the sample dilution for the above data set reduced the CBD content, an undiluted sample was run and analyzed. This data is reported in Table 4.
Table 4- CBD and Total CBD potency values for the same cannabis flower sample processed through different sample preparation techniques.
The CBD results indicated that with the “Potency Extraction Method 1” (methanol extraction) coupled with RC filter, allowed for a greater CBD recovery. This may indicate the loss of CBD with an ACN/QuEChERS extraction.
With an average ~14% total THC and 0.06% total CBD for a homogenous cannabis flower sample, the optimal sample preparation extraction was determined to be a methanol extraction coupled with filtration using a regenerated cellulose filter. Since potency continues to remain at the forefront of cannabis regulatory testing it is important to utilize the right sample prep for your cannabis samples.
References
Wang M, Wang YH, Avula B, Radwan MM, Wanas AS, Mehmedic Z, et al. Quantitative Determination of Cannabinoids in Cannabis and Cannabis Products Using Ultra-High-Performance Supercritical Fluid Chromatography and Diode Array/Mass Spectrometric Detection. Journal of Forensic Sciences 2016;62(3):602-11.
Matthew Curtis, Eric Fausett, Wendi A. Hale, Ron Honnold, Jessica Westland, Peter J. Stone, Jeffery S. Hollis, Anthony Macherone. Cannabis Science and Technology, September/October 2019, Volume 2, Issue 5.
Sian Ferguson. https://www.healthline.com/health/hemp-vs-marijuana. August 27, 2020.
Taschwer M, Schmid MG. Determination of the relative percentage distribution of THCA and 9-THC in herbal cannabis seized in Austria- Impact of different storage temperatures on stability. Forensic Science International 2015; 254:167-71.
Storm C, Zumwalt M, Macherone A. Dedicated Cannabinoid Potency Testing Using the Agilent 1220 Infinity II LC System. Agilent Technologies, Inc. Application Note 5991-9285EN
bioMérieux, a leader in the in vitro diagnostics space and a supporter of the cannabis testing market, announced last month that they have achieved the first ever AOAC International approval for PCR Multiplex Detection of STEC and Salmonella in cannabis flower for their GENE-UP® PRO STEC/Salmonella Assay. The performance tested method approval for their new assay accomodates simultaneous enrichment and detection of STEC (Shiga Toxigenic Escherichia coli) and Salmonella spp. in cannabis samples.
The method is aimed at increasing efficiency in cannabis testing labs by reducing sample preparation time for microbiological testing. With the single enrichment and real-time multiplex PCR detection, bioMérieux says their new assay can provide reliable detection of STEC and Salmonella in 24 hours using just a single test.
PCR technology is one of the most widely utilized testing methods for detecting pathogens in a variety of matrices. bioMérieux claims it is easy to use, scientifically robust and reduces costs, time spent testing and errors.
Maria McIntyre, cannabis strategic operations business manager at bioMérieux, says that AOAC performance tested method approval is setting the bar for cannabis testing laboratories and furthering cannabis science. “AOAC International impacts cannabis science by setting analytical method standards that act as the benchmark for method validation,” says McIntyre. “This simplifies the validations needed by cannabis laboratories and assures the utmost confidence in product safety and human health.”
Last week, just before MJBizCon, PerkinElmer announced a collaboration with Emerald Scientific, allowing Emerald Scientific customers access to PerkinElmer’s portfolio of cannabis and hemp testing products and services. PerkinElmer is a leading instrument manufacturer and analytical method developer. Emerald Scientific is a distributor for scientific lab testing equipment and instrumentation.
Emerald Scientific now offers their customers PerkinElmer products, like their QSight® 420 Triple Quad system LC/MS, the Titan MPS™ Microwave Sample Preparation System, the Clarus® SQ 8 Gas Chromatograph/Mass Spectrometer (GC/MS) and the Flexar™ High-Performance Liquid Chromatography (HPLC) system. This partnership also allows Emerald Scientific customers to utilize the PerkinElmer analytical methods and standard operating procedures (SOPs) for cannabis and hemp testing. That includes SOPs for things like sample preparation, acquisition methods and consumable use. They’ll also be able to shop for lab products like PerkinElmer’s chromatography columns, vials and sample prep products.
According to Greg Sears, vice president and general manager, Food and Organic Mass Spectrometry at PerkinElmer, the cannabis testing market is exploding and this will help labs get their equipment and necessities all in the same place. “With the cannabis and hemp markets continuing to grow rapidly and regulations strengthening, labs increasingly need streamlined access to best-in-class, user-friendly testing solutions geared toward the unique requirements of the industry,” says Sears. ““This collaboration with Emerald Scientific brings together leading cannabis analysis offerings in one place to help labs start up and expand more efficiently. In addition, we can build on the work we have done with Emerald around testing standardization which is important for the science of the industry.”
Kirsten Blake, Vice President of Emerald Scientific, says they are really excited about the partnership. “As regulations become more challenging, laboratory competition intensifies, and the science of the industry receives increasing focus, it is essential to align with organizations dedicated to improving both the quality and throughput of analytics,” says Blake. “After working with PerkinElmer to inform, educate, and advance the cannabis science industry around best practices, we see them as the industry leader for providing analytical instrumentation, methods and SOP’s. By adding their complementary solutions to our existing portfolio, we can now deliver complete packaged analytical solutions to the cannabis and hemp industries.”
Microbial contamination on cannabis products represents one of the most significant threats to cannabis consumers, particularly immunocompromised patients who are at risk of developing harmful and potentially fatal infections.
As a result, regulatory bodies in the United States and Canada mandate testing cannabis products for certain microbes. The two most popular methods for microbial safety testing in the cannabis industry are culture-based testing and quantitative polymerase chain reaction (qPCR).
When considering patient safety, labs should choose a method that provides an accurate account of what is living on the sample and can specifically target the most harmful microbes, regardless of the matrix.
1. The Method’s Results Must Accurately Reflect the Microbial Population on the Sample
The main objective of any microbial safety test is to give the operator an indication of the microbial population present on the sample.
Figure 1: MA data collected directly from plant material before and after culture on 3M petrifilm and culture-based platforms.
Culture-based methods measure contamination by observing how many organisms grow in a given medium. However, not all microbial organisms grow at the same rate. In some cases, certain organisms will out-compete others and as a result, the population in a post-culture environment is radically different than what was on the original sample.
One study analyzed fifteen medicinal cannabis samples using two commercially available culture-based methods. To enumerate and differentiate bacteria and fungi present before and after growth on culture-based media, all samples were further subjected to next-generation sequencing (NGS) and metagenomic analyses (MA). Figure 1 illustrates MA data collected directly from plant material before and after culture on 3M petrifilm and culture-based platforms.
The results demonstrate substantial shifts in bacterial and fungal growth after culturing on the 3M petrifilm and culture-based platforms. Thus, the final composition of microbes after culturing is markedly different from the starting sample. Most concerning is the frequent identification of bacterial species in systems designed for the exclusive quantification of yeast and mold, as quantified by elevated total aerobic count (TAC) Cq values after culture in the total yeast and mold (TYM) medium. The presence of bacterial colonies on TYM growth plates or cartridges may falsely increase the rejection rate of cannabis samples for fungal contamination. These observations call into question the specificity claims of these platforms.
The Live Dead Problem
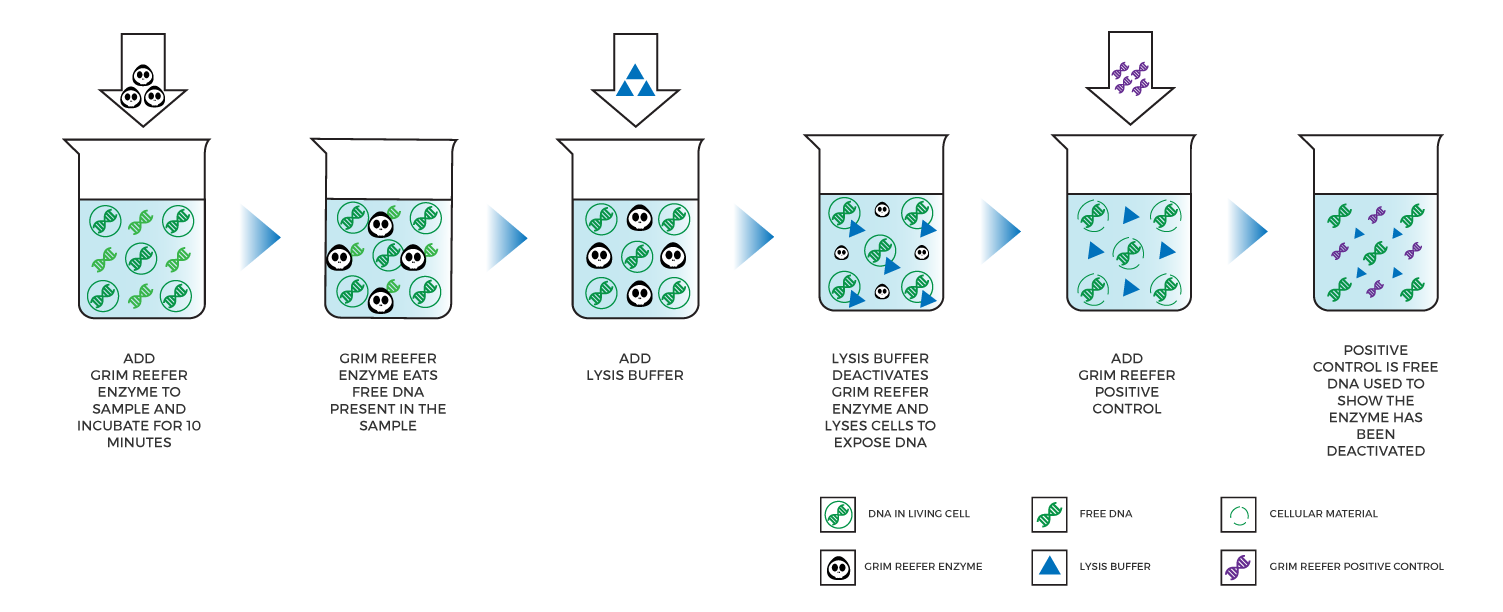
Figure 2: The enzyme is instantaneously inactivated when lysis buffer is added
One of the common objections to using qPCR for microbial safety testing is the fact that the method does not distinguish between live and dead DNA. PCR primers and probes will amplify any DNA in the sample that matches the target sequence, regardless of viability. Critics claim that this can lead to false positives because DNA from non-viable organisms can inflate results. This is often called the Live-Dead problem. However, scientists have developed multiple solutions to this problem. Most recently, Medicinal Genomics developed the Grim Reefer Free DNA Removal Kit, which eliminates free DNA contained in a sample by simply adding an enzyme and buffer and incubating for 10 minutes. The enzyme is instantaneously inactivated when lysis buffer is added, which prevents the Grim Reefer Enzyme from eliminating DNA when the viable cells are lysed (see Figure 2).
2. Method Must Be Able to Detect Specific Harmful Species
Figure 3: The team spiked a known amount of live E. coli into three different environments
Conversely, qPCR assays, such as the PathoSEEK, are designed to target DNA sequences that are unique to pathogenic Aspergillus species, and they can be run using standard qPCR instruments such as the Agilent AriaMx. The primers are so specific that a single DNA base difference in the sequence can determine whether binding occurs. This specificity reduces the frequency of false positives in pathogen detection, a frequent problem with culture-based cannabis testing methods.
Additionally, Medicinal Genomics has developed a multiplex assay that can detect the four pathogenic species of Aspergillus (A. flavus, A. fumigatus, A. niger, and A. terreus) in a single reaction.
3. The Method Must Work on Multiple Matrices
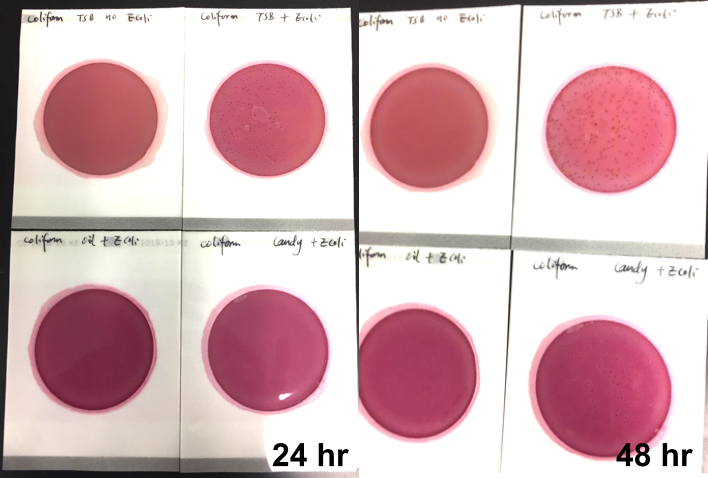
Figure 4: The team also placed TSB without any E. coli onto a petrifilm to serve as a control.
Marijuana infused products (MIPs) are a very diverse class of matrices that behave very differently than cannabis flowers. Gummy bears, chocolates, oils and tinctures all present different challenges to culture-based techniques as the sugars and carbohydrates can radically alter the carbon sources available for growth. To assess the impact of MIPs on colony-forming units per gram of sample (CFU/g) enumeration, The Medicinal Genomics team spiked a known amount of live E. coli into three different environments: tryptic soy broth (TSB), hemp oil and hard candy. The team then homogenized the samples, pipetted amounts from each onto 3M™ Petrifilm E. coli / Coliform Count (EC) Plates, and incubated for 96 hours. The team also placed TSB without any E. coli onto a petrifilm to serve as a control. Figures 3 and 4 show the results in 24-hour intervals.
Table 1: DNA was spiked into various MIPs
This implies the MIPs are interfering with the reporter assay on the films or that the MIPs are antiseptic in nature.
Many MIPs use citric acid as a flavoring ingredient which may interfere with 3M reporter chemistry. In contrast, the qPCR signal from the Agilent AriaMx was constant, implying there is microbial contamination present on the films, but the colony formation or reporting is inhibited.
Table 3: SenSATIVAx DNA extraction can successfully lyse the cells of the microbesTable 2: Different numbers of DNA copies spiked into chocolate
This is not an issue with DNA-based methods, so long as the DNA extraction method has been validated on these matrices. For example, the SenSATIVAx DNA extraction method is efficient in different matrices, DNA was spiked into various MIPs as shown in Table 1, and at different numbers of DNA copies into chocolate (Table 2). The SenSATIVAx DNA extraction kit successfully captures the varying levels of DNA, and the PathoSEEK detection assay can successfully detect that range of DNA. Table 3 demonstrates that SenSATIVAx DNA extraction can successfully lyse the cells of the microbes that may be present on cannabis for a variety of organisms spiked onto cannabis flower samples.
Editor’s Note: The following is based on research and studies performed in their Santa Cruz Lab, with contributions from Mikhail Gadomski, Lab Manager, Ryan Maus, Technical Services Analyst, Dr. Laurie Post, Director of Food Safety & Compliance, Andy Sechler, Lab Director, Toby Astill, Senior Business Development Leader at Perkin Elmer and Charles Deibel, President of Deibel Cannabis Labs.
Pesticides represent the leading cause of batch failures in the cannabis industry. They are also the hardest tests to run in the laboratory, even one equipped with state-of-the-art equipment. The best instruments on the market are HPLC and GC dual mass spectrometer detectors, called “HPLC-qqq”, “GC-qqq,” or just triple quads.
As non-lab people, we envision a laboratory that can take a cannabis sample, inject it into a triple quad and have the machine quickly and effortlessly print out a report of pesticide values. Unfortunately, this is far from reality. The process is much more hands on and complex.In the current chemistry lab, trained analysts have to first program the triple quads to look for the pesticides of concern; in cannabis pesticide testing, this is done by programming the first of two mass spectrometers to identify a single (precursor) mass that is characteristic of the pesticide in question. For BCC requirements in California, this has to be done for all 66 pesticides, one at a time.
Next, these precursor ions are degraded into secondary chemicals called the “product” ions, also called transition ions. The second of the two mass spectrometers is used to analyze these transition ions. This process is graphed and the resulting spectrum is analyzed by trained chemists in the lab, pesticide by pesticide, for all the samples processed that day. If the lab analyzes 10 samples, that translates to 660 spectra to analyze (66 pesticides x 10 samples). When looking at the spectra for each pesticide, the analysts must compare the ratios of the precursor ions to the product ions.
Confirmation Testing
If these spectra indicate a given pesticide may be present, the chemists must then compare the ratios between the precursor and the products. If these ratios are not what is expected, then the analyst must perform confirmation testing to prove the precursor mass either is or is not the pesticide of concern. If the ratios are not what is expected, it means the molecule is similar to the pesticide in question, but may not be that pesticide. This confirmatory testing is key to producing accurate results and not failing batches when dealing with closely related chemicals. This process of analyzing spectra is done in all labs that are performing pesticide testing. In this fledgling industry, there are few published cannabis pesticide methods.
The need for this type of confirmation testing doesn’t happen all of the time, but when it does, it will take longer than our targeted three-day turn-around time. In the picture above, one precursor mass is ionized into several product masses; but only two are large enough to be used for comparison. In this hypothetical situation, two product masses are produced for every one precursor, the expected ion abundance ratio should be less than 30%. When performing any confirmatory testing, if the ion abundance ratio is >30%, it means the original precursor molecule was not the pesticide of concern. For example, if the ion abundance ratio was 50%, then the original molecule broke down into too many parts; it was not the pesticide we were looking for. This ion abundance ratio threshold was established by FANCO, the international organization that sets guidelines for all pesticide testing.
Testing Strategies
Methodology: In this fledgling industry, there are few published cannabis pesticide methods. The identification of the precursor mass and product ions are not always published, leaving labs to research which ions should be used. This adds to the potential for differences between lab results. Once selected, labs should validate their research, through a series of experiments to ensure the correct precursor and transition (product) ions are being used in the method.
Sample Preparation: Beyond the time-consuming work that is required to develop sound pesticide methods, the extraction step is absolutely critical for credible results. If the pesticides aren’t fully extracted from the cannabis product, then the results will be lower than expected. Sample preparations are often not standardized between labs, so unless a given extraction technique is validated for accuracy, there is the possibility for differences between labs.
Getting a Representative Sample
The current California recommended amount of sample is one gram of product per batch. Batch sizes can vary greatly and it is entirely likely that two different one gram samples can have two different results for pesticides. Has the entire plant been evenly coated with exactly the same amount of pesticide onto every square inch of its leaves? No, probably not. That is why it is imperative to take a “random” sample, by taking several smaller samples from different areas of the entire batch.
Sampling Plans: We can learn a lot from the manufacturing and sampling best practices developed by the food industry through the years. If a food manufacturer is concerned with the possibility of having a bacteria pathogen, like Salmonella, in their finished product, they test the samples coming off their production lines at a statistically relevant level. This practice (theory) is called the sampling plan and it can easily be adapted to the cannabis industry. The basic premise is that the more you test, the higher your likelihood of catching a contaminate. Envision a rectangular swimming pool, but instead of water, it’s filled with jello. In this gelatinous small pool, 100 pennies are suspended at varying levels. The pennies represent the contaminates.
Is the pool homogenized? Is jello evenly represented in the entire pool? Yes.
Is your concentrate evenly distributed in the extraction vessel? Yes. The question is, where are the pennies in that extraction vessel? The heavy metals, the microbial impurities and the pesticides should be evenly distributed in the extraction vessel but they may not be evenly represented in each sample that is collected. Unfortunately, this is the bane of the manufacturing industry and it’s the unfortunate reality in the food industry. If you take one random cup of jello, will you find the penny? Probably not. But it you take numerous 1 cup samples from random areas within the batch, you increase your chances of finding the contaminate. This is the best approach for sampling any cannabis product.
The best way to approve a batch of cannabis product is to take several random samples and composite them. But you may need to run several samples from this composite to truly understand what is in the batch. In the swimming pool example, if you take one teaspoon scoop, will you find one of the pennies? The best way to find one of the pennies is to take numerous random samples, composite them and increase the number of tests you perform at the lab. This should be done on any new vendor/cultivator you work with, in order to help establish the safety of the product.
Editor’s Note: The following is based on research and studies performed in their Santa Cruz Lab, with contributions from Mikhail Gadomski, Lab Manager, Ryan Maus Technical Services Analyst, Laurie Post, Director of Food Safety & Compliance, and Charles Deibel, President Deibel Cannabis Labs.
Heavy metals are common environmental contaminants resulting from human industrial activities such as mining operations, industrial waste, automotive emissions, coal fired power plants and farm/house hold water run-off. They affect the water and soil, and become concentrated in plants, animals, pesticides and the sediments used to make fertilizers. They can also be present in low quality glass or plastic packaging materials that can leach into the final cannabis product upon contact. The inputs used by cultivators that can be contaminated with heavy metals include fertilizers, growing media, air, water and even the clone/plant itself.
The four heavy metals tested in the cannabis industry are lead, arsenic, mercury and cadmium. The California Bureau of Cannabis Control (BCC) mandates heavy metals testing for all three categories of cannabis products (inhalable cannabis, inhalable cannabis products and other cannabis and cannabis products) starting December 31, 2018. On an ongoing basis, we recommend cultivators test for the regulated heavy metals in R&D samples any time there are changes in a growing process including changes to growing media, cannabis strains, a water system or source, packaging materials and fertilizers or pesticides. Cultivators should test the soil, nutrient medium, water and any new clones or plants for heavy metals. Pre-qualifying a new packaging material supplier or a water source prior to use is a proactive approach that could bypass issues with finished product.
Testing Strategies
The best approach to heavy metal detection is the use of an instrument called an Inductively Coupled Plasma Mass Spectrometry (ICP-MS). There are many other instruments that can test for heavy metals, but in order to achieve the very low detection limits imposed by most states including California, the detector must be the ICP-MS. Prior to detection using ICP-MS, cannabis and cannabis related products go through a sample preparation stage consisting of some form of digestion to completely break down the complex matrix and extract the heavy metals for analysis. This two-step process is relatively fast and can be done in a single day, however, the instruments used to perform the digestion are usually the limiting step as the digesters run in a batch of 8-16 samples over a 2-hour period.
Only trace amounts of heavy metals are allowed by California’s BCC in cannabis and cannabis products. A highly sensitive detection system finds these trace amounts and also allows troubleshooting when a product is found to be out of specification.
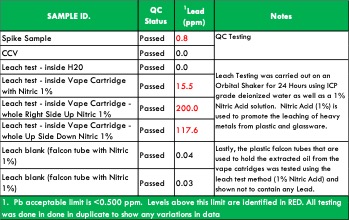
For example, during the course of testing, we have seen lead levels exceed the BCC’s allowable limit of 0.5 ppm in resin from plastic vape cartridges. An investigation determined that the plastic used to make the vape cartridge was the source of the excessive lead levels. Even if a concentrate passes the limits at the time of sampling, the concern is that over time, the lead leached from the plastic into the resin, increasing the concentration of heavy metals to unsafe levels.
Getting a Representative Sample
The ability to detect trace levels of heavy metals is based on the sample size and how well the sample represents the entire batch. The current California recommended amount of sample is 1 gram of product per batch. Batch sizes can vary but cannot be larger than 50 pounds of flower. There is no upper limit to the batch sizes for other inhalable cannabis products (Category II).
It is entirely likely that two different 1 gram samples of flower can have two different results for heavy metals because of how small a sample is collected compared to an entire batch. In addition, has the entire plant evenly collected and concentrated the heavy metals into every square inch of it’s leaves? No, probably not. In fact, preliminary research in leafy greens shows that heavy metals are not evenly distributed in a plant. Results from soil testing can also be inconsistent due to clumping or granularity. Heavy metals are not equally distributed within a lot of soil and the one small sample that is taken may not represent the entire batch. That is why it is imperative to take a “random” sample by collecting several smaller samples from different areas of the entire batch, combining them, and taking a 1 g sample from this composite for analysis.
Citterio, S., A. Santagostino, P. Fumagalli, N. Prato, P. Ranalli and S. Sgorbati. 2003. Heavy metal tolerance and accumulation of Cd, Cr and Ni by Cannabis sativa L.. Plant and Soil 256: 243–252.
Linger, P. J. Mussig, H. Fischer, J. Kobert. 2002. Industrial hemp (Cannabis sativa L.) growing on heavy metal contaminated soil: fibre quality and phytoremediation potential. Ind. Crops Prod. 11, 73–84.
By Dr. Zacariah Hildenbrand, Allegra Leghissa, Dr. Kevin A. Schug 2 Comments
Have you ever wondered why all beers have that strong, characteristic smell? Or why you could tell the smell of cannabis apart from any other plant? The answer is simple – terpenes.
These 55,000 different molecules are responsible for a majority of the odors and fragrances around us, from a pine forest, to the air diffuser in your house 1–3. They all share the same precursor, isoprene, and because of that, they are all related and have similar molecular structures. Unfortunately, it is this uncanny similarity that makes their analysis so challenging; we still lack a complete list of which terpenes expected to be found in each given plant species 1,2.
Many different methods have been developed in an effort to provide a time-optimized and straightforward analysis. Gas chromatography (GC) is usually center stage due to the volatility of the terpenes. Therefore, there is significant concern with the type of GC detector used 2.
The flame ionization detector (FID) is a good quantitative detector for GC, but qualitatively it does not provide any information, except for retention time; the differentiation between terpene species is achieved solely by use of retention indices (RI), which are based on elution times from a particular GC stationary phase. The best part of the FID is its low cost, reliability, and relatively easy interface, which make it an effective tool for quality control (QC) but less so with respect to research and discovery 2.
The primary choice for a research setting is the mass spectrometer (MS) detector. It is more expensive and complicated than FID, but importantly, it provides both good quantitative capabilities, and it provides mass spectra for each species that elutes from the chromatograph. However, for terpene analysis, it may still not be the best detector choice. Since terpene class molecules share many structural and functional similarities, even their fragmentation and sub-sequential identification by MS may lead to inconsistent results, which need to be confirmed by use of RI. Still, MS is a better qualitative analysis tool than the FID, especially for distinguishing non-isobaric terpenes 2.
Recently, new technology based on vacuum ultraviolet spectroscopy (VUV) has been developed as a new GC detector. The VUV detector enables analysis of virtually all molecules; virtually all chemical compounds absorb light in the range in the 125-240 nm wavelength range probed by the detector, making it an essentially universal detector 4–11. Previously, spectroscopic absorption detectors for GC have lacked sufficient energy to measure absorption of most GC-amenable species. The VUV detector fills a niche, which is complementary to MS detection in terms of the qualitative information it provides.
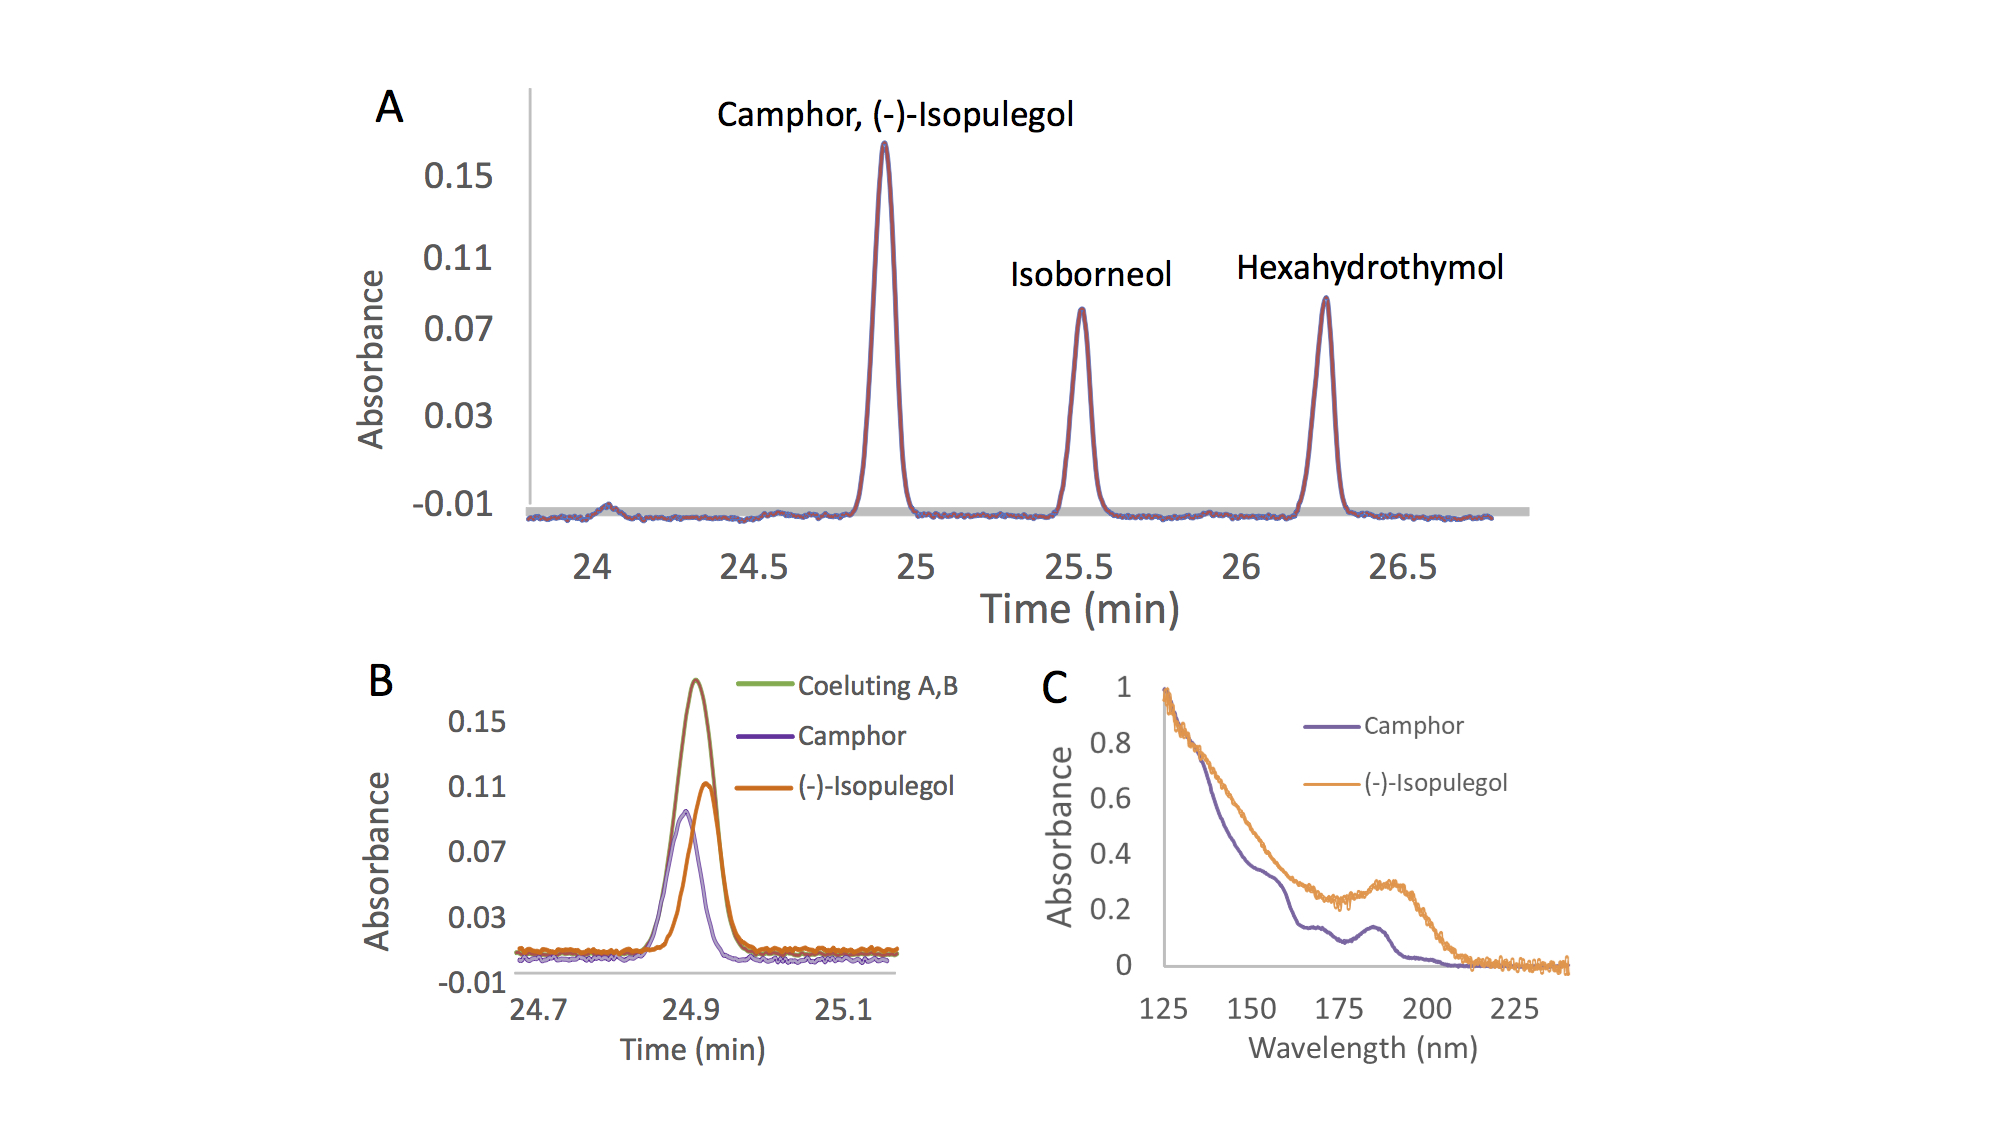
Figure 1: A, Section of the chromatographic separation of a terpenes standard mix; B, highlight of the co-eluting terpenes, camphor and (-)-isopulegol; C, differences in the absorbance spectra of camphor and (-)-isopulegol.
With the VUV detector, each compound exhibits its own unique absorbance spectrum. Even isomers and isobars, which are prevalent in terpene mixtures and can be difficult to distinguish different species by their electron ionization mass spectra, can be well differentiated based on their VUV spectra 6,9,10. Nevertheless, because analytes exhibit different spectra, it is not required to achieve a perfect chromatographic separation of the mixture components. Co-eluting peaks can be separated post-run through the use of library spectra and software inherent to the instrument 4,10. This ability is called “deconvolution”, and it is based on the fact that two co-eluting terpenes will give a peak with an absorbance spectrum equal to the sum of the two single absorbance spectra 4. Figure 1 shows the deconvolution process for two co-eluting terpenes, camphor and (-)-isopulegol. Due to their different absorbance spectra (Figure 1C), it is possible to fully separate the two peaks in post-run, obtaining sharp peaks for both analytes 6.
The deconvolution process has been shown to yield precise and accurate results. Thus, chromatographic resolution can be sacrificed in favor of spectroscopic resolution; this enables the development of methods with faster run times. With the ability to deconvolve unresolved peaks, a long temperature ramp to chromatographically separate all isomeric terpenes is not required 6. Additionally, the presence of coeluting components, which might normally go undetected with some GC detectors, can be easily judged based on comparison of the measured spectra with pure reference spectra contained in the VUV spectral library.
The other issue in terpenes analysis is the extraction process. Terpenes can be extracted with the use of solvents (e.g., methanol, ethanol, hexane, and cyclohexane, among others), but the process is usually time-consuming, costly and not so environmentally-friendly 2. The plant needs to be manually crushed and then aliquots of solvent are used to extract components from the plant, ideally at least 3 times and combined to achieve acceptable results. The problem is that some terpenes may respond better to a certain solvent, making their extraction easier and more optimized than for others 2. The choice of solvent can cause discrimination against the extraction some terpenes, which limits the comprehensiveness of analysis.
Headspace is another technique that can be used for the sample preparation of terpenes. Headspace sampling is based on heating the solid or liquid sample inside a sealed vial, and then analyzing the air above it after sufficient equilibration. In this way, only volatile analytes are extracted from the solid/liquid sample into the gas phase; this allows relatively interference-free sampling 12–14.
How do we know whether our extraction analysis methods are correct and comprehensive for a certain plant sample? Unfortunately, there is not a complete list of available molecules for each plant species, and even if two specimens may smell really similar to our nose, their terpenes profiles may be notably different. When working with a new plant material, it is difficult to predict the extraction efficiency for the vast array of terpenes that may be present. We can only perform it with different extraction and detection methods, and compare the results.
The route for a comprehensive and fast analysis of terpenes is therefore still long; however, their intoxicating aromas and inherent medicinal value has provided a growing impetus for researchers around the world. Considering the evolving importance of Cannabis and the growing body of evidence on the synergistic effects between terpenes and cannabinoids, it is likely that newly improved extraction and analysis methods will be developed, paving the way for a more complete list of terpene species that can be found in different cultivars. The use of new analytical technologies, such as the VUV detector for GC, should aid considerably in this endeavor.
References:
[1] Breitmaier E., Terpenes: Flavors, Fragrances, Pharmaca, Pheromones. John Wiley & Sons 2006.
[2] Leghissa A., Hildenbrand Z. L., Schug K. A., A Review of Methods for the Chemical Characterization of Cannabis Natural Products. J. Sep. Sci.2018, 41, 398–415 .
[3] Benvenuto E., Misra B. B., Stehle F., Andre C. M., Hausman J.-F., Guerriero G., Cannabis sativa: The Plant of the Thousand and One Molecules. Front. Plant Sci2016, 719, DOI: 10.3389/fpls.2016.00019.
[4] Schug K. A., Sawicki I., Carlton D. D., Fan H.,Mcnair H. M.,Nimmo J. P., Kroll P.,Smuts J.,Walsh P., Harrison D., Vacuum Ultraviolet Detector for Gas Chromatography. Anal. Chem.2014, 86, 8329–8335 .
[5] Fan H.,Smuts J., Walsh P.,Harrison D., Schug K. A., Gas chromatography-vacuum ultraviolet spectroscopy for multiclass pesticide identification. J. Chromatogr. A2015, DOI: 10.1016/j.chroma.2015.02.035.
[6] Qiu C.,Smuts J., Schug K. A., Analysis of terpenes and turpentines using gas chromatography with vacuum ultraviolet detection. J. Sep. Sci.2017, 40, 869–877 .
[7] Leghissa A., Smuts J., Qiu C., Hildenbrand Z. L., Schug K. A., Detection of cannabinoids and cannabinoid metabolites using gas chromatography-vacuum ultraviolet spectroscopy. Sep. Sci. Plus2018, 1.
[8] Bai L.,Smuts J., Walsh P., Fan H., Hildenbrand Z., Wong D., Wetz D., Schug K. A., Permanent gas analysis using gas chromatography with vacuum ultraviolet detection. J. Chromatogr. A2015,1388, 244–250 .
[9] Skultety L., Frycak P., Qiu C.,Smuts J., Shear-Laude L., Lemr K., Mao J. X., Kroll P., Schug K. A., Szewczak A., Vaught C., Lurie I., Havlicek V., Resolution of isomeric new designer stimulants using gas chromatography – Vacuum ultraviolet spectroscopy and theoretical computations. Anal. Chim. Acta2017, 971, 55–67 .
[10] Bai L., Smuts J., Walsh P., Qiu C., McNair H. M., Schug K. ., Pseudo-absolute quantitative analysis using gas chromatography–vacuum ultraviolet spectroscopy–a tutorial. Anal. Chim. Acta2017, 953, 10–22 .
[11] Schenk J., Nagy G., Pohl N. L. B., Leghissa A., Smuts J., Schug K. A., Identification and deconvolution of carbohydrates with gas chromatography-vacuum ultraviolet spectroscopy. J. Chromatogr. A2017, 1513, 210–221 .
[12] Van Opstaele F., De Causmaecker B., Aerts G., De Cooman L., Characterization of novel varietal floral hop aromas by headspace solid phase microextraction and gas chromatography-mass spectrometry/olfactometry. J. Agric. Food Chem.2012, 60, 12270−12281 .
[13] Hamm S., Bleton J., Connan J., Tchapla A., A chemical investigation by headspace SPME and GC-MS of volatile and semi-volatile terpenes in various olibanum samples. Phytochemistry2005,66, 1499–1514 .
[14] Aberl A., Coelhan M., Determination of volatile compounds in different hop Varieties by headspace-trap GC/MS-in comparison with conventional hop essential oil analysis. J. Agric. Food Chem.2012, 60, 2785−2792 .
This website uses cookies so that we can provide you with the best user experience possible. Cookie information is stored in your browser and performs functions such as recognising you when you return to our website and helping our team to understand which sections of the website you find most interesting and useful.
Strictly Necessary Cookies
Strictly Necessary Cookie should be enabled at all times so that we can save your preferences for cookie settings.
We use tracking pixels that set your arrival time at our website, this is used as part of our anti-spam and security measures. Disabling this tracking pixel would disable some of our security measures, and is therefore considered necessary for the safe operation of the website. This tracking pixel is cleared from your system when you delete files in your history.
We also use cookies to store your preferences regarding the setting of 3rd Party Cookies.
If you disable this cookie, we will not be able to save your preferences. This means that every time you visit this website you will need to enable or disable cookies again.