Tag Archives: marijuana testing

The Practical Chemist

Building the Foundation of Medical Cannabis Testing – Understanding the Use of Standards and Reference Materials – Part 2

By Joe Konschnik
No Comments

In the last article I referred to the analogy of the analytical reference material being a keystone of the laboratory foundation, the stone upon which all data relies. I then described the types of reference materials and their use in analytical testing in general terms. This article will describe the steps required to properly manufacture and deliver a certified reference material (CRM) along with the necessary documentation.

A CRM is an exclusive reference material that meets strict criteria defined by ISO Guide 34 and ISO/IEC 17025.  ISO is the International Organization for Standardization and IEC is the International Electrotechnical Commission. These organizations work together to set globally recognized standards. In order for a reference material to be labeled as a CRM it must 1) be made with raw or starting materials which are characterized using qualified methods and instruments, 2) be produced in an ISO-accredited lab under documented procedures, and 3) fall under the manufacturer’s scopes of accreditation. Verifying a CRM supplier has these credentials is easily done by viewing their certificates which should include their scopes of accreditation. Restek_accredit

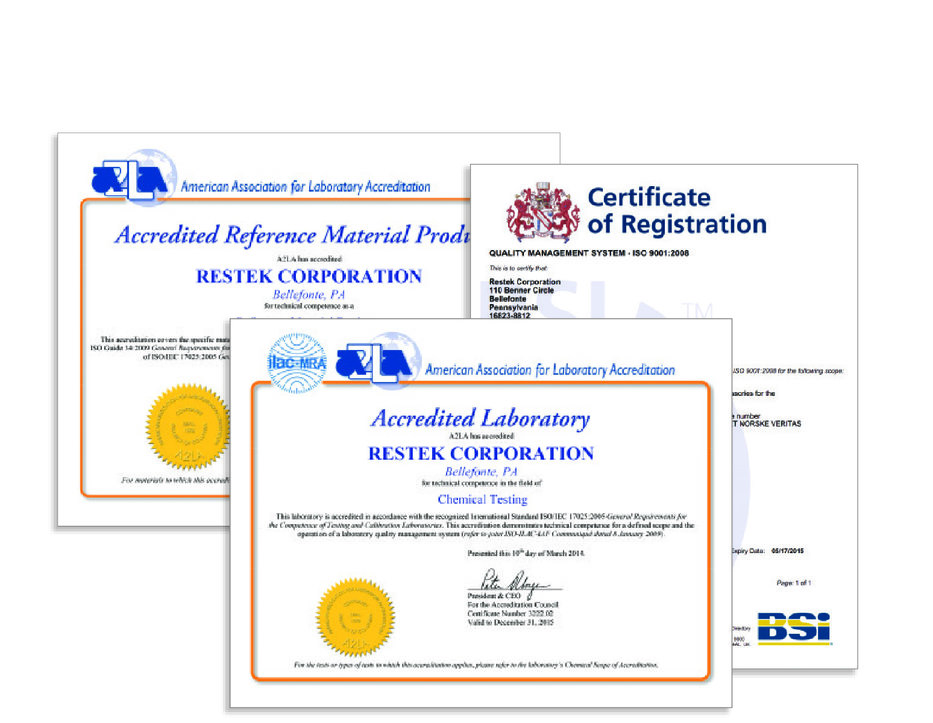
There are many steps required to produce a CRM that meets the above three criteria.  The first step requires a review of the customer’s, or end-user’s requirements to carefully define what is to be tested, at what levels and which analytical workflow will be used.  Such information enables the producer to identify the proper compounds and solvents required to properly formulate the requested CRM.

The next step requires sourcing and acquiring the raw, or starting materials, then verifying their compatibility and stability using stability and shipping studies in accordance with ISO requirements. Next the chemical identify and purity of the raw materials must be characterized using one or more analytical techniques such as: GC-FID, HPLC, GC-ECD, GC-MS, LC-MS, refractive index and melting point. In some cases, the percent purity is changed by the producer when their testing verifies it’s different from the supplier label. All steps are of course documented.

restek_CRM
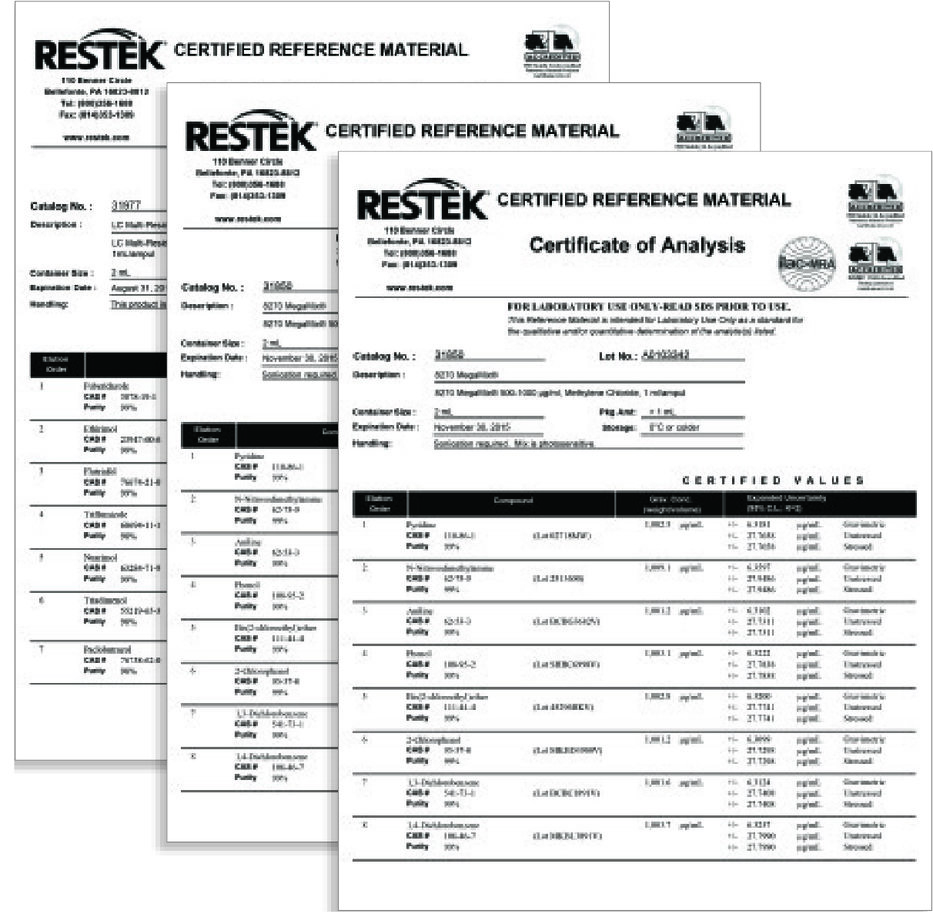
The producer’s analytical balances must be verified using NIST traceable weights and calibrated annually by an accredited third party provider to guarantee accurate measurement. CRMs must be prepared using Class A volumetric glassware, and all ampules and vials used in preparation and final packaging must be chemically treated to prevent compound degradation during storage. Next, CRMs are packaged in an appropriate container, labeled then properly stored to maintain the quality and stability until it’s ready to be shipped. All labels must include critical storage, safety and shelf life information to meet federal requirements. The label information must be properly linked to documentation commonly referred to as a certificate of analysis (COA) which describes all of the above steps and verifies the traceability and uncertainty of all measurements for each compound contained in the CRM. Restek_CRM2

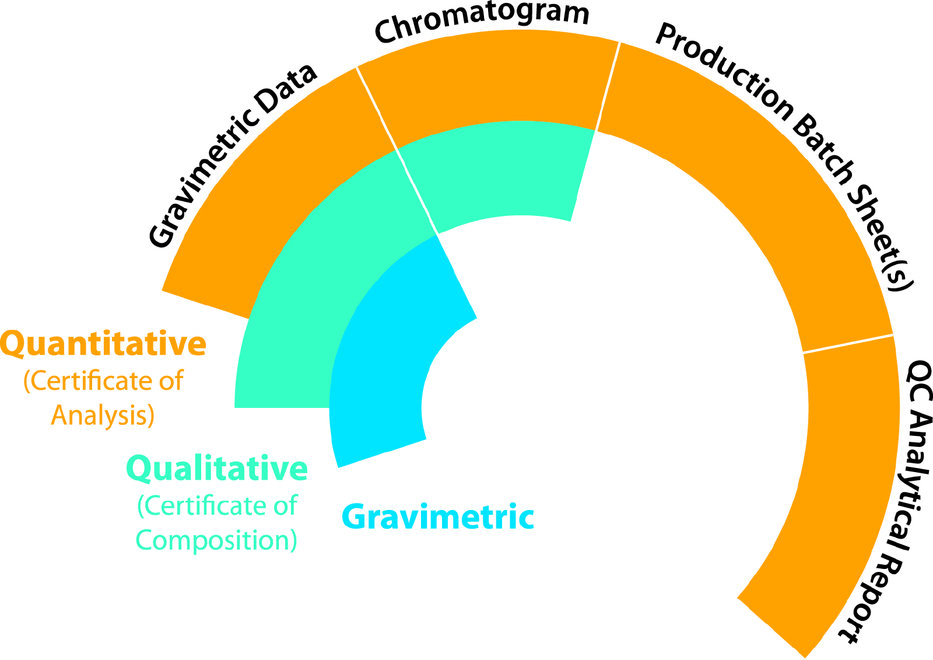
My company, RESTEK, offers a variety of documentation choices to accompany each CRM. Depending on the intended use and data quality objectives specified by the end-user, which were defined way back at the first step, three options are typically offered: They include gravimetric only, qualitative which includes gravimetric, and fully quantitative which includes all three levels of documentation. The graphic to the right summarizes the three options and what they include.

It’s important to understand which level you’re purchasing especially when ordering a custom CRM from a supplier. Most stock CRMs include all three levels of documentation, but it’s important to be sure.

Understanding what must be done to produce and deliver a CRM sets it apart from other reference material types, however it’s important to understand there are some instances where CRMs are either not available, nor required and in those situations other types of reference materials are perfectly acceptable.

If you have any questions or would like more details about reference materials please contact me, Joe Konschnik at (800) 356-1688 ext. 2002 by phone, or email me at joe.konschnik@restek.com.

A2LA, Americans for Safe Access Announce Cannabis-Specific Lab Accreditation

By Aaron G. Biros
2 Comments

The American Association for Laboratory Accreditation (A2LA) and Americans for Safe Access (ASA) announced yesterday a collaboration to develop a cannabis-specific laboratory accreditation program based upon the requirements of ISO/IEC 17025 and ASA’ s Patient Focused Certification (PFC) Program. AccreditationPFC logo for PR under this program will offer the highest level of recognition and provide the most value to the laboratory and users of the products tested, according to a press release published yesterday. ASA is the largest medical cannabis patient advocacy group in the United States. “A2LA is pleased to partner with ASA to offer a cannabis testing laboratory accreditation program to ISO/IEC 17025 as well as the additional laboratory requirements from ASA’s Patient Focused Certification Program,” says Roger Brauninger, biosafety program manager at A2LA.

PFC-A2LA
Pictured left to right: Kristin Nevedal, Program Manager, PFC at ASA;
Jahan Marcu, Ph.D Chief Scientist, PFC at ASA;
Roger Brauninger, BioSafety Program Manager, A2LA;
Michelle Bradac, Senior Accreditation Officer, A2LA

The program affirms that cannabis laboratories are compliant with state and local regulations and ensures that they adhere to the same standards that are followed by laboratories used and inspected by the Environmental Protection Agency (EPA), the United States Department of Agriculture (USDA), and the U.S. Consumer Product Safety Commission (CPSC) among other regulatory bodies. The two non-profit organizations will offer their first joint training course at A2LA’s headquarters in Maryland from July 11th to the 15th. During this course, participants will receive training on PFC’s national standards for the cultivation, manufacture, dispensing, and testing of cannabis and cannabis products, combined with ISO/IEC 17025 training.

The guidelines for cannabis operations that serve as the basis for this accreditation program were issued by the American Herbal Products Association (AHPA) Cannabis Committee, an industry stakeholder panel, and have already been adopted by sixteen states. “We are very excited to see the PFC program join the ISO/IEC 17025 accreditation efforts to help fully establish a robust and reliable cannabis testing foundation,” says Jeffrey Raber, chief executive officer of The Werc Shop, a PFC-certified cannabis testing laboratory. “It is a great testament to ASA’s commitment to quality in their PFC program by partnering with a world-renowned accrediting body to set a new standard for cannabis testing labs.”A2LA logo

According to Kristin Nevedal, program director of PFC, this is an important first in the industry. “This new, comprehensive accreditation program affirms laboratory operations are meeting existing standards and best practices, adhering to the ISO/IEC 17025 criteria, and are compliant with state and local regulations,” says Nevedal. “This program is the first of its kind developed specifically for the cannabis industry, giving confidence to patients as well as regulators that their test results on these products are accurate and consistent.”

“The program will combine the expertise and resources of the country’s largest accreditation body with the scientific rigor and knowledge base of the nation’s largest medical cannabis advocacy group, benefitting the myriad of laboratories tasked with analyzing cannabis products,” says Nevedal. According to Brauninger, a cannabis-specific accreditation program is vital to the industry’s constantly shifting needs. “The ability to now offer a cannabis testing laboratory accreditation program that is tailored to address the unique concerns and issues of the industry will help to add the necessary confidence and trust in the reliability and safety of the cannabis products on the market,” says Brauninger. “Those laboratories that gain accreditation under this program will be demonstrating that they adhere to the most comprehensive and relevant set of criteria by their compliance to both the underlying framework of the internationally recognized ISO/IEC 17025:2005 quality management system standard and the specific guidelines issued by the AHPA Cannabis Committee.” This type of collaboration could represent a milestone in progress toward achieving a higher level of consumer safety in the cannabis industry.

amandarigdon
The Practical Chemist

Calibration Part II – Evaluating Your Curves

By Amanda Rigdon
No Comments
amandarigdon

Despite the title, this article is not about weight loss – it is about generating valid analytical data for quantitative analyses. In the last installment of The Practical Chemist, I introduced instrument calibration and covered a few ways we can calibrate our instruments. Just because we have run several standards across a range of concentrations and plotted a curve using the resulting data, it does not mean our curve accurately represents our instrument’s response across that concentration range. In order to be able to claim that our calibration curve accurately represents our instrument response, we have to take a look at a couple of quality indicators for our curve data:

  1. correlation coefficient (r) or coefficient of determination (r2)
  2. back-calculated accuracy (reported as % error)

The r or r2 values that accompany our calibration curve are measurements of how closely our curve matches the data we have generated. The closer the values are to 1.00, the more accurately our curve represents our detector response. Generally, r values ≥0.995 and r2 values ≥ 0.990 are considered ‘good’. Figure 1 shows a few representative curves, their associated data, and r2 values (concentration and response units are arbitrary).

Figure 1: Representative Curves and r2 values

Let’s take a closer look at these curves:

Curve A: This represents a case where the curve perfectly matches the instrument data, meaning our calculated unknown values will be accurate across the entire calibration range.

Curve B: The r2 value is good and visually the curve matches most of the data points pretty well. However, if we look at our two highest calibration points, we can see that they do not match the trend for the rest of the data; the response values should be closer to 1250 and 2500. The fact that they are much lower than they should be could indicate that we are starting to overload our detector at higher calibration levels; we are putting more mass of analyte into the detector than it can reliably detect. This is a common problem when dealing with concentrated samples, so it can occur especially for potency analyses.

Curve C: We can see that although our r2 value is still okay, we are not detecting analytes as we should at the low end of our curve. In fact, at our lowest calibration level, the instrument is not detecting anything at all (0 response at the lowest point). This is a common problem with residual solvent and pesticide analyses where detection levels for some compounds like benzene are very low.

Curve D: It is a perfect example of our curve not representing our instrument response at all. A curve like this indicates a possible problem with the instrument or sample preparation.

So even if our curve looks good, we could be generating inaccurate results for some samples. This brings us to another measure of curve fitness: back-calculated accuracy (expressed as % error). This is an easy way to determine how accurate your results will be without performing a single additional run.

Back-calculated accuracy simply plugs the area values we obtained from our calibrators back into the calibration curve to see how well our curve will calculate these values in relation to the known value. We can do this by reprocessing our calibrators as unknowns or by hand. As an example, let’s back-calculate the concentration of our 500 level calibrator from Curve B. The formula for that curve is: y = 3.543x + 52.805. If we plug 1800 in for y and solve for x, we end up with a calculated concentration of 493. To calculate the error of our calculated value versus the true value, we can use the equation: % Error = [(calculated value – true value)/true value] * 100. This gives us a % error of -1.4%. Acceptable % error values are usually ±15 – 20% depending on analysis type. Let’s see what the % error values are for the curves shown in Figure 1.

practical chemist table 1
Table 1: % Error for Back-Calculated Values for Curves A – D

Our % error values have told us what our r2 values could not. We knew Curve D was unacceptable, but now we can see that Curves B and C will yield inaccurate results for all but the highest levels of analyte – even though the results were skewed at opposite ends of the curves.

There are many more details regarding generating calibration curves and measuring their quality that I did not have room to mention here. Hopefully, these two articles have given you some tools to use in your lab to quickly and easily improve the quality of your data. If you would like to learn more about this topic or have any questions, please don’t hesitate to contact me at amanda.rigdon@restek.com.