Earlier this year, the Colorado Department of Public Health and Environment (CDPHE) announced a plan to introduce new testing rules for the state’s growing hemp industry. Under the new regulations, hemp products must be tested for residual solvents, heavy metals and pesticides, in addition to making sure they contain less than 0.3% THC.
The CDPHE are planning on a gradual rollout to prevent any supply chain issues or a lab testing bottleneck, similar to what we’ve seen in other states launching new testing requirements in years past, such as Arizona or California. Well, the Colorado rollout appears to be hitting similar snags and because of supply chain issues related to instruments and consumables in laboratories, the implementation of those testing rules is somewhat delayed. What was originally supposed to be implemented over the summer was pushed back to an October 1 deadline, and that deadline has now been pushed back to 2022.
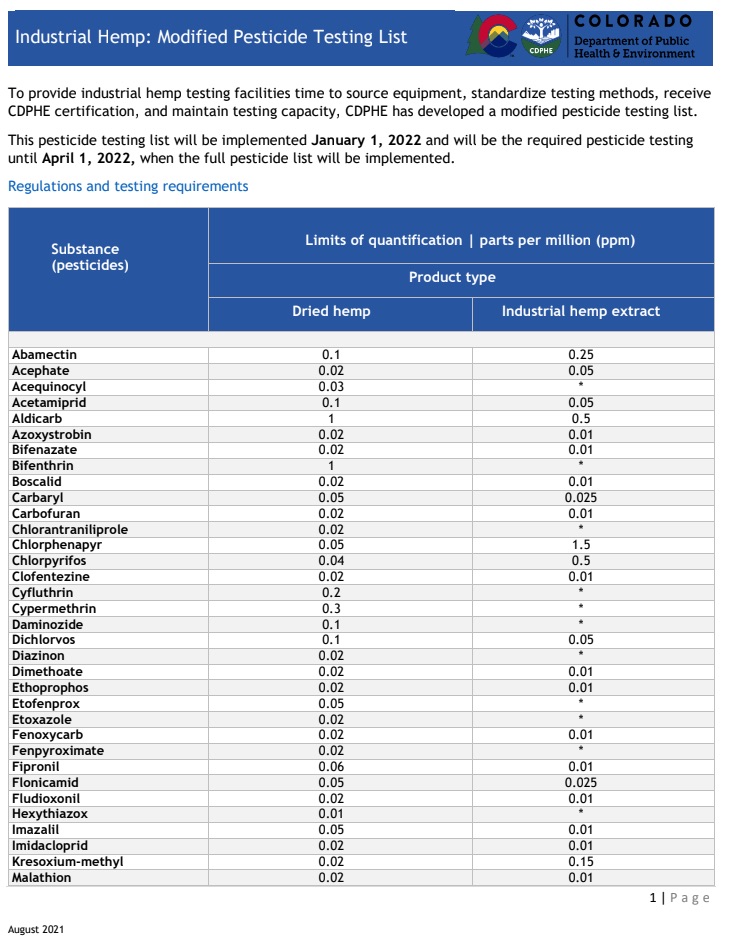
The pesticide testing list to be implemented January 1, 2022
As a result of supply chain shortages and the learning curve to test for such a wide range of pesticides, Colorado is opening hemp testing to out-of-state labs in an effort to stay on schedule with the rollout. Dillon Burns, lab manager at InfiniteCAL, a cannabis testing company with locations in California and Michigan, just completed an audit with the CDPHE in their work to get certified and start conducting hemp testing for businesses in Colorado.
Burns says they’re well-acquainted with the list of pesticides because of how similar the list is to California’s requirements. “For the pesticide testing rules that were supposed to go into effect on August 1st, it’s basically the same list as California just with slightly different action levels,” says Burns. “I would say these action limits are generally stricter – they have much lower LOQs [limits of quantification].”
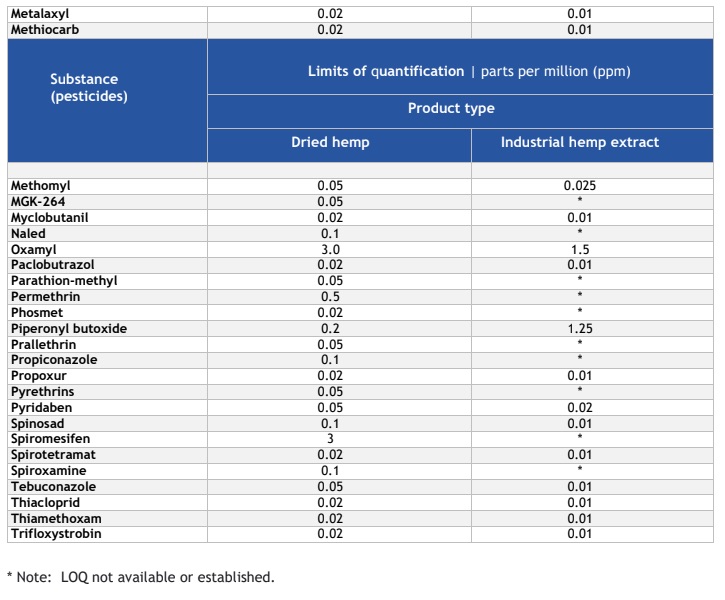
The pesticide testing list (continued) to be implemented January 1, 2022
Come January 1, 2022, they are expecting an additional 40 pesticides to be required under the new rules. “But currently, it’s still unclear when these regulations will actually go into effect,” says Burns. The full pesticide testing list is currently slated to be implemented on April 1, 2022.
The supply chain issues referenced above have a lot to do with what the state is asking labs to test for. Previously, most of the pesticides tested for under Colorado’s adult use and medical cannabis programs could be analyzed with an LC/MS. A handful of pesticides on the new list do require GC/MS, says Burns. It’s entirely possible that a lot of labs in Colorado just don’t have a GC/MS or are in the process of training staff and developing methods for using the new instrument. “Cleanliness of these instruments is such a priority that it takes time to acquire the right skill set for it,” says Burns.
Dillon Burns, Lab Manager at InfiniteCAL
The new testing rollout isn’t just another compliance hurdle for the cannabis industry; these rules are about protecting public health. Dillon Burns said he’s seen hiccups in California with the amount of new hemp farmers getting into the space. “The hemp products we’ve tested in California often fail for pesticides,” says Burns. It’s a lot easier in most states to get a license for growing hemp than it would be for growing adult use cannabis. “You’ll see a lot more novice growers getting into hemp farming without a background in it. They’ll fail for things they just haven’t considered, like environmental drift. We see a lot of fails in CA. Hemp is bioaccumulating so it presents a lot of problems. If they’re not required to look for it, they weren’t monitoring it.”
When asked how the market might react to the new rules, Burns was confident that Colorado knows what they’re doing. “I don’t anticipate that [a testing bottleneck] happening here. The regulators are reasonable, supportive of the industry and opening it up to out-of-state labs should help in preventing that.”
According to a press release, Shimadzu Scientific Instruments and Front Range Biosciences (FRB) announced a partnership where they will establish the FRB Hemp Science Center of Excellence. The center will focus on genetics, biobanking, breeding and analysis, all with Shimadzu instrumentation. The center will host scientists performing chemical and genetic analytical research to “support the development of new hemp varieties for the production of cannabinoids, terpenoids and other compounds for medical and wellness applications; lipid, wax and protein ingredients for food and cosmetics applications; and fiber for industrial applications.”
Dr. Jon Vaught, CEO of Front Range Biosciences
Located at FRB’s new headquarters in Boulder, CO, the new center will allow for collaborative efforts between researchers from the public and private sectors like academic, nonprofit and government agencies. The center will expand FRB’s collaboration with the University of Colorado at Boulder. Researchers at other institutions can apply for grants to support students, postdoctoral candidates and other researchers at the new center.
Dr. Jonathan Vaught, CEO of FRB, says they’re honored to work with Shimadzu and their instrumentation. “Front Range Biosciences is honored to partner with the world-class team at Shimadzu. Combining their innovative and proven cannabis and hemp analytical instrumentation solutions with our next-generation breeding program, we will be well positioned to continue advancing the industry with data-driven science so we can harness the incredible potential of this versatile plant for therapeutic, wellness, nutrition and industrial applications,” says Dr. Vaught. “We are confident that with Shimadzu’s cutting-edge technology, we will be able to drive forward-thinking solutions in this growing industry to better serve farmers, producers and consumers.”
“I really wanted an outlet for me, like someone like me, to be able to help out in this fight,” Wells said in a Harvard Crimson interview. “I knew I was, by far, not the only one who felt this way. And so what happened was, on the walk home from work that day from the lab, I thought, ‘Hey, I should try to organize something here in Boston so I could potentially be a part of a group that makes themselves available to health department officials or county officials.’”
Volunteers are made up of a mix of laboratory scientists, data scientists, software engineers, medical writers, CEOs and epidemiologists – from academic research institutes, national labs and private industry. Many state and local government agencies and organizations have already accessed the list for reference, including FEMA.
PCR testing is used in a wide variety of applications Image: Peggy Greb, USDA
Members of the cannabis industry can help to combat COVID-19. “The cannabis industry relies on specialized laboratories that routinely perform qPCR-based microbial tests,” says Wells. “As a result, these labs have basic skill sets and facilities required to participate in community COVID-19 testing.” Quantitative Polymerase chain reaction (qPCR), is a common technique for determining if there are microbial contaminants in flower, concentrates and infused products.
Some cannabis industry leaders have already taken to the call. “With the trend in legalization, the cannabis industry has built an excess testing capacity in anticipation of an increase in volumes,” says David Winternheimer, PhD, CEO of Pacific Star Labs, a Los Angeles-based cannabis research organization with an ISO-accredited testing laboratory. “As an essential industry, cannabis companies are open to helping the wider population in a crisis like this, and testing could easily be adopted in labs with excess microbial testing capacity.”
Michael Wells and his band of volunteers are asking to help get the word out to other scientists who would like to sign-up at https://covid19sci.org and for anyone to help share the database link with any relevant person in government or health services. “Right now, it is all hands on deck. We need every lab, facility, and pair of skilled hands to be deployed in this fight against the most dangerous pathogen our species has experienced at this scale in our lifetimes.”
endCoronavirus.org is a volunteer organization with over 6,000 members built and maintained by the New England Complex Systems Institute (NECSI) and its collaborators. The group specializes in networks, agent-based modeling, multi-scale analysis and complex systems and provides expert information on how to stop COVID-19.
The COVID-19 National Scientist Volunteer Database is a database of over 8,000 scientists from all 50 states, DC, Puerto Rico, and Guam who are eager to volunteer our time, expertise, equipment, and consumables to help you respond to the COVID-19 crisis. They have aggregated our contact information, locations, and skills sets into this easy to use centralized database. Their members include experts in scientific testing, bioinformatics, and data management, as well as key contacts willing to donate lab space and testing supplies.
The spectacular rise and crash of the Canadian cannabis stock market has been painful to watch, let alone to experience as an industry insider. The hype around the market has vanished and many investors are left disappointed. Large sustainable gains simply haven’t materialized as promised. The producers are clearly suffering. They have consistently been shedding value as they’ve been posting losses every quarter. Stock prices have plummeted along with consumer confidence. Attempts to reduce the cash bleeds through mergers, acquisitions, layoffs, restructures, fund raises, among others, have not resulted in any significant recovery. In short, the current model of a cannabis industry has failed.
Dr. Markus Roggen, Founder of Complex Biotech Discovery Ventures (CBDV)
How could it have been different? What should the industry have done differently? What makes the difference between failure and success? A recent article published in Nature (Volume 575) by Yin et al. titled “Quantifying the Dynamics of Failure Across Science, Startups and Security” analyzes the underlying principles of success. The article studies success rates of many groups after numerous attempts across three domains. One of the domains being analyzed are startup companies and their success in raising funds through many attempts at investment acquisition. The authors point out that the most important factor that determines success is not relentless trying but is actually learning after each attempt. Learning allows successful groups to accelerate their failures, making minute adjustments to their strategy with every attempt. Learning behavior is also seen early in the journey. This means that groups will show higher chances of success early on, if they learn from their mistakes.
If you want to succeed, you need to analyze the current state, test the future state, evaluate performance difference and implement the improved state.
This also needs to happen in the cannabis industry. Producers have been utilizing inefficient legacy systems for production. They have shackled themselves to these inefficient methods by becoming GMP-certified too early. Such certifications prevent them from experimenting with different designs that would enhance their process efficiency and product development. This inflexibility prevents them from improving. This means they are setting themselves up for ultimate failure. GMP is not generally wrong, as it ensures product safety and consistency. Although, at this early stage in the cannabis industry, we just don’t yet have the right processes to enshrine.
How can cannabis producers implement the above-mentioned research findings and learn from their current situation? In an ever-changing business environment, it is companies that are nimble, innovative and fast enough to continually refine themselves that end up succeeding. This agility allows them to match their products with the needs of their consumers and market dynamics. booking.com, a travel metasearch engine, is the prime example of this ethos because they carry out thousands of experiments per year. They have embraced failure through rapid experimentation of different offerings to gauge user feedback. Experimentation has allowed booking.com to learn faster than the competition and build a stronger business.
Soheil Nasseri, Business Associate at Complex Biotech Discovery Ventures (CBDV)
At CBDV, we put the need for iterative experimentation, failure and improvements to achieve breakthroughs at the core of our company. We pursue data to guide our decisions, not letting fear of momentary failure detract us from ultimate success. We continuously explore multiple facets of complex problems to come up with creative solutions.
A good example of how failure and rapid innovation guided us to success is our work on decarboxylation. We were confronted by the problem that the decarboxylation step of cannabis oil was inconsistent and unpredictable. Trying different reaction conditions did not yield a clear picture. We realized that the most important obstacle for improvements was the slow analysis by the HPLC. Therefore, we turned our attention to developing a fast analysis platform for decarboxylation. We found this in a desktop mid-IR instrument. With this instrument and our algorithm, we now could instantaneously track decarboxylation. We now hit another roadblock, a significant rate difference in decarboxylation between THCA and CBDA. We needed to understand the theoretical foundation of this effect to effectively optimize this reaction. So, we moved to tackle the problem from a different angle and employed computational chemistry to identify the origin of the rate difference. Understanding the steric effect on rate helped us focus on rapid, iterative experimentation. Now, with everything in place, we can control the decarboxylation at unrivaled speeds and to the highest precision.
If producers want to regain the trust of the market, they must embrace their failures and begin to learn. They should decrease their reliance on inefficient legacy production methods and experiment with new ones to find what is right for them. Experimentation brings new ways of production, innovative products and happier customers, which will result in higher profits. Producers should strive to implement experimentation into their corporate cultures. This can be done in collaboration with research companies like CBDV or through development of inhouse ‘centers of excellence.’
Last week, just before MJBizCon, PerkinElmer announced a collaboration with Emerald Scientific, allowing Emerald Scientific customers access to PerkinElmer’s portfolio of cannabis and hemp testing products and services. PerkinElmer is a leading instrument manufacturer and analytical method developer. Emerald Scientific is a distributor for scientific lab testing equipment and instrumentation.
Emerald Scientific now offers their customers PerkinElmer products, like their QSight® 420 Triple Quad system LC/MS, the Titan MPS™ Microwave Sample Preparation System, the Clarus® SQ 8 Gas Chromatograph/Mass Spectrometer (GC/MS) and the Flexar™ High-Performance Liquid Chromatography (HPLC) system. This partnership also allows Emerald Scientific customers to utilize the PerkinElmer analytical methods and standard operating procedures (SOPs) for cannabis and hemp testing. That includes SOPs for things like sample preparation, acquisition methods and consumable use. They’ll also be able to shop for lab products like PerkinElmer’s chromatography columns, vials and sample prep products.
According to Greg Sears, vice president and general manager, Food and Organic Mass Spectrometry at PerkinElmer, the cannabis testing market is exploding and this will help labs get their equipment and necessities all in the same place. “With the cannabis and hemp markets continuing to grow rapidly and regulations strengthening, labs increasingly need streamlined access to best-in-class, user-friendly testing solutions geared toward the unique requirements of the industry,” says Sears. ““This collaboration with Emerald Scientific brings together leading cannabis analysis offerings in one place to help labs start up and expand more efficiently. In addition, we can build on the work we have done with Emerald around testing standardization which is important for the science of the industry.”
Kirsten Blake, Vice President of Emerald Scientific, says they are really excited about the partnership. “As regulations become more challenging, laboratory competition intensifies, and the science of the industry receives increasing focus, it is essential to align with organizations dedicated to improving both the quality and throughput of analytics,” says Blake. “After working with PerkinElmer to inform, educate, and advance the cannabis science industry around best practices, we see them as the industry leader for providing analytical instrumentation, methods and SOP’s. By adding their complementary solutions to our existing portfolio, we can now deliver complete packaged analytical solutions to the cannabis and hemp industries.”
Across the country and across the world, governments that legalize cannabis implement increasingly rigorous requirements for laboratory testing. Helping to protect patients and consumers from contaminants, these requirements involve a slew of lab tests, including quantifying the levels of microbial contaminants, pathogens, mold and heavy metals.
Cannabis and hemp have a unique ability to accumulate elements found in soil, which is why these plants can be used as effective tools for bioremediation. Because cannabis plants have the ability to absorb potentially toxic and dangerous elements found in the soil they grow in, lab testing regulations often include the requirement for heavy metals testing, such as Cadmium, Lead, Mercury, Arsenic and others.
In addition to legal cannabis markets across the country, the USDA announced the establishment of the U.S. Domestic Hemp Production Program, following the enactment of the 2018 Farm Bill, essentially legalizing hemp. This announcement comes with information for hemp testing labs, including testing and sampling guidelines. While the information available on the USDA’s website only touches on testing for THC, required to be no greater than 0.3% dry weight concentration, more testing guidelines in the future are sure to include a discussion of heavy metals testing.
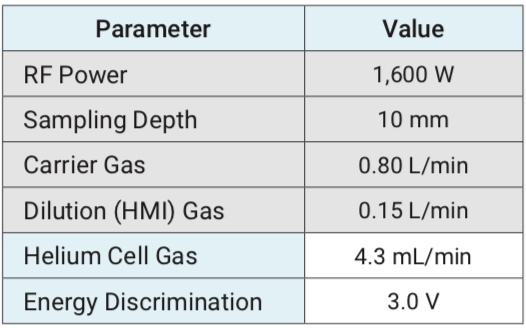
Table 1. ICP-MS operating conditions (shaded parameters were automatically optimized during start up for the HMI conditions).
In an application note produced by Agilent Technologies, Inc., the Agilent 7800 ICP-MS was used to analyze 25 elements in a variety of cannabis and hemp-derived products. The study was conducted using that Agilent 7800 ICP-MS, which includes Agilent’s proprietary High Matrix Introduction (HMI) system. The analysis was automated by using the Agilent SPS 4 autosampler.
Instrumentation
The instrument operating conditions can be found in Table 1. In this study, the HMI dilution factor was 4x and the analytes were all acquired in the Helium collision mode. Using this methodology, the Helium collision mode consistently reduces or completely eliminates all common polyatomic interferences using kinetic energy discrimination (KED).
Table 2. Parameters for microwave digestion.
As a comparison, Arsenic and Selenium were also acquired via the MassHunter Software using half-mass correction, which corrects for overlaps due to doubly charged rare earth elements. This software also collects semiquantitative or screening data across the entire mass region, called Quick Scan, showing data for elements that may not be present in the original calibration standards.
SRMs and Samples
Standard reference materials (SRMs) analyzed from the National Institute of Standards and Technology (NIST) were used to verify the sample prep digestion process. Those included NIST 1547 Peach Leaves, NIST 1573a Tomato Leaves and NIST 1575 Pine Needles. NIST 1640a Natural Water was also used to verify the calibration.
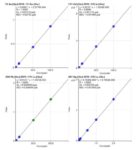
Figure 1. Calibration curves for As, Cd, Pb, and Hg.
Samples used in the study include cannabis flower, cannabis tablets, a cannabidiol (CBD) tincture, chewable candies and hemp-derived cream.
Sample Preparation
Calibration standards were prepared using a mix of 1% HNO3 and 0.5% HCl. Sodium, Magnesium, Potassium, Calcium and Iron were calibrated from 0.5 to 10 ppm. Mercury was calibrated from 0.05 to 2 ppb. All the other elements were calibrated from 0.5 to 100 ppb.
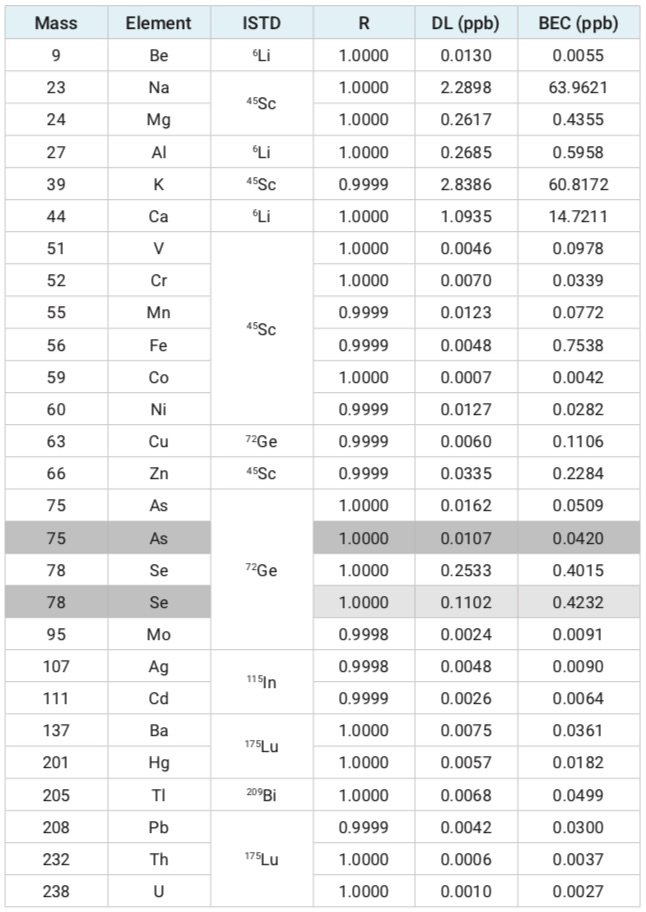
Table 3. Calibration summary data acquired in He mode. Data for As and Se in shaded cells was obtained using half mass correction tuning.
After weighing the samples (roughly 0.15 g of cannabis plant and between 0.3 to 0.5 g of cannabis product) into quartz vessels, 4 mL HNO3 and 1 mL HCl were added and the samples were microwave digested using the program found in Table 2.
HCI was included to ensure the stability of Mercury and Silver in solution. They diluted the digested samples in the same acid mix as the standards. SRMs were prepared using the same method to verify sample digestion and to confirm the recovery of analytes.
Four samples were prepared in triplicate and fortified with the Agilent Environmental Mix Spike solution prior to the analysis. All samples, spikes and SRMs were diluted 5x before testing to reduce the acid concentration.
Calibration
Table 4. ICV and CCV recovery tests. Data for As and Se in shaded cells was obtained using half mass correction tuning.
The calibration curves for Arsenic, Cadmium, Lead and Mercury can be found in Figure 1 and a summary of the calibration data is in Table 3. For quality control, the SRM NIST 1645a Natural Water was used for the initial calibration verification standard. Recoveries found in Table 4 are for all the certified elements present in SRM NIST 1640a. The mean recoveries and concentration range can also be found in Table 4. All the continuing calibration solution recoveries were within 10% of the expected value.
Internal Standard Stability
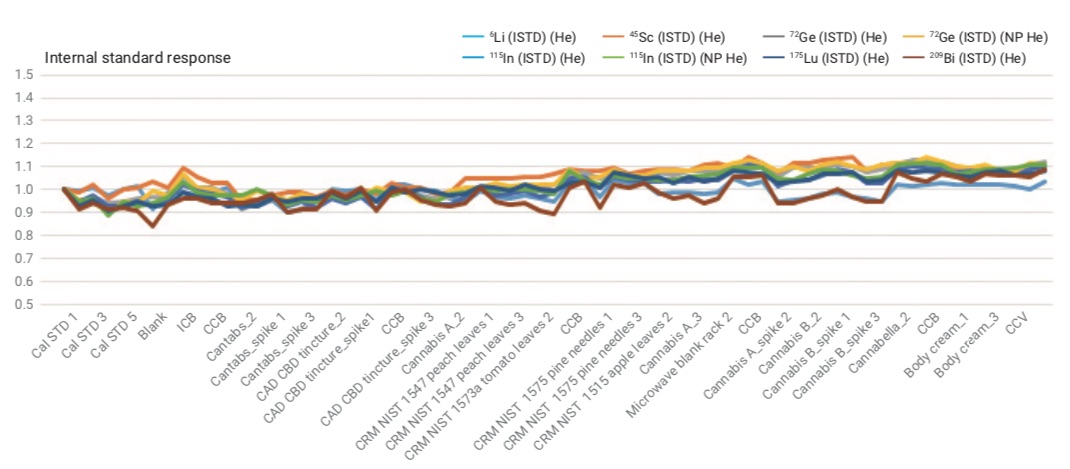
Figure 2 highlights the ISTD signal stability for the sequence of 58 samples analyzed over roughly four hours. The recoveries for all samples were well within 20 % of the value in the initial calibration standard.
Figure 2. Internal standard signal stability for the sequence of 58 samples analyzed over ~four hours.
Results
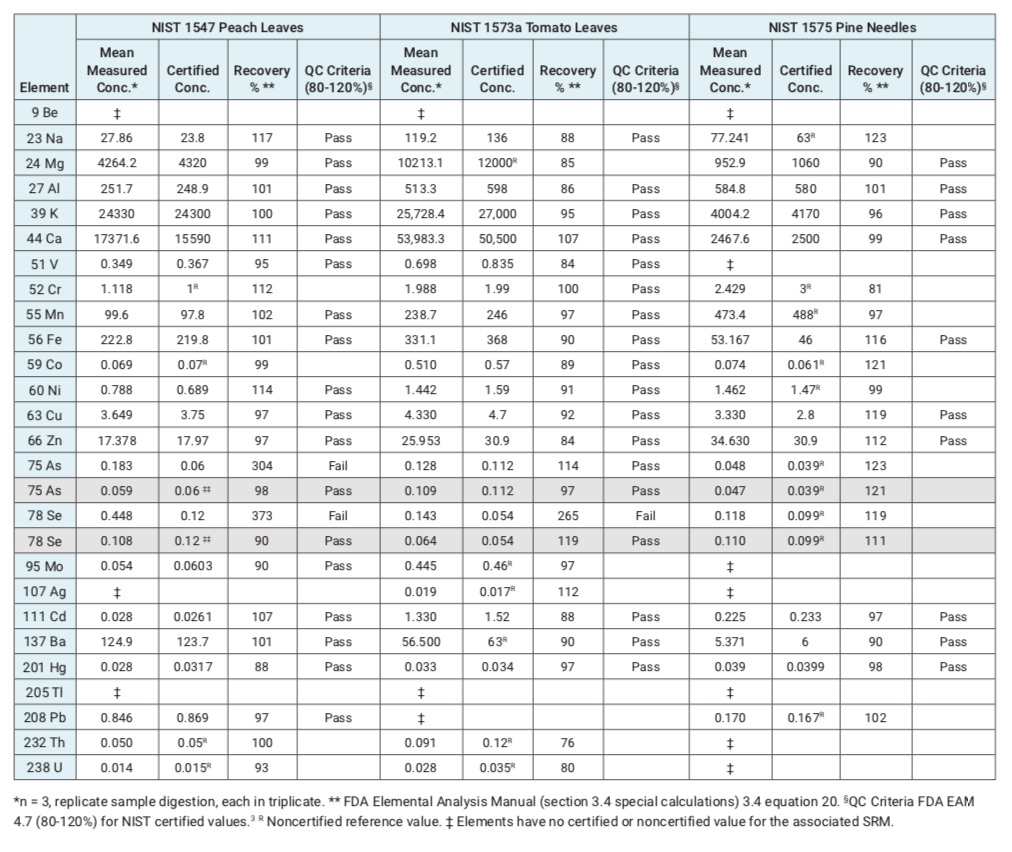
In Table 5, you’ll find that three SRMs were tested to verify the digestion process. The mean results for most elements agreed with the certified concentrations, however the results for Arsenic in NIST 1547 and Selenium in both NIST 1547 and 1573a did not show good agreement due to interreferences formed from the presence of doubly-charged ions
Table 5. Mean concentrations (ppm) of three repeat measurements of three SRMs, including certified element concentrations, where appropriate, and % recovery.
Some plant materials can contain high levels of rare earth elements, which have low second ionization potentials, so they tend to form doubly-charged ions. As the quadrupole Mass Spec separates ions based on their mass-to-charge ratio, the doubly-charged ions appear at half of their true mass. Because of that, a handful of those doubly-charged ions caused overlaps leading to bias in the results for Arsenic and Selenium in samples that have high levels of rare earth elements. Using half mass correction, the ICP-MS corrects for these interferences, which can be automatically set up in the MassHunter software. The shaded cells in Table 5 highlight the half mass corrected results for Arsenic and Selenium, demonstrating recoveries in agreement with the certified concentrations.
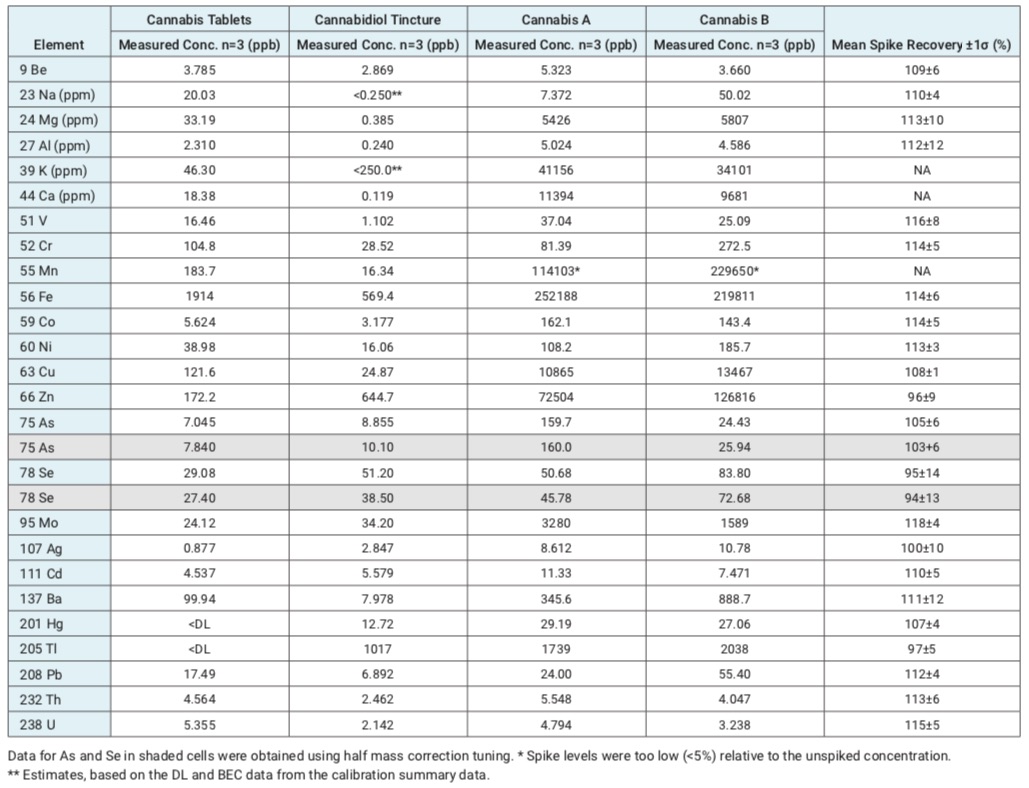
In Table 6, you’ll find the quantitative results for cannabis tablets and the CBD tincture. Although the concentrations of Arsenic, Cadmium, Lead and Cobalt are well below current regulations’ maximum levels, they do show up relatively high in the cannabis tablets sample. Both Lead and Cadmium also had notably higher levels in the CBD tincture as well.
Table 6. Quantitative data for two cannabis-related products and two cannabis samples plus mean spike recovery results. All units ppb apart from major elements, which are reported as ppm.
A spike recovery test was utilized to check the accuracy of the method for sample analysis. The spike results are in Table 6.
Using the 7800 ICP-MS instrument and the High Matrix Introduction system, labs can routinely analyze samples that contain high and very variable matrix levels. Using the automated HMI system, labs can reduce the need to manually handle samples, which can reduce the potential for contamination during sample prep. The MassHunter Quick Scan function shows a complete analysis of the heavy metals in the sample, including data reported for elements not included in the calibration standards.
The half mass correction for Arsenic and Selenium allows a lab to accurately determine the correct concentrations. The study showed the validity of the microwave sample prep method with good recovery results for the SRMs. Using the Agilent 7800 ICP-MS in a cannabis or hemp testing lab can be an effective and efficient way to test cannabis products for heavy metals. This test can be used in various stages of the supply chain as a tool for quality controls in the cannabis and hemp markets.
Disclaimer: Agilent products and solutions are intended to be used for cannabis quality control and safety testing in laboratories where such use is permitted under state/country law.
The cannabis industry is growing exponentially, and the use of cannabis for medical purposes is being adopted across the nation. With this boom in cannabis consumers, there has been an increasing need for knowledge about the product.
The role of testing labs has become crucial to the process, which makes owning and operating a lab more lucrative. Scientists testing for potency, heavy metals, pesticides, residual solvents, moisture, terpene profile, microbial and fungal growth, and mycotoxins/aflatoxins are able to make meaningful contributions to the medical industry by making sure products are safe, while simultaneously generating profits and a return on investment.
Here are the key testing instruments you need to conduct these critical analyses. Note that cannabis analytical testing requirements may vary by state, so be sure to check the regulations applicable to the location of your laboratory.
Potency Testing
High-performance liquid chromatograph (HPLC) designed for quantitative determination of cannabinoid content.
The most important component of cannabis testing is the analysis of cannabinoid profiles, also known as potency. Cannabis plants naturally produce cannabinoids that determine the overall effect and strength of the cultivar, which is also referred to as the strain. There are many different cannabinoids that all have distinct medicinal effects. However, most states only require testing and reporting for the dry weight percentages of delta-9-tetrahydrocannabinol (Δ9-THC) and cannabidiol (CBD). It should be noted that delta-9-tetrahydrocannabinolic acid (Δ9-THCA) can be converted to THC through oxidation with heat or light.
For potency testing, traditional high-performance liquid chromatography (HPLC) is recommended and has become the gold standard for analyzing cannabinoid profiles. Look for a turnkey HPLC analyzer that delivers a comprehensive package that integrates instrument hardware, software, consumables and proven HPLC methods.
Heavy Metal Testing
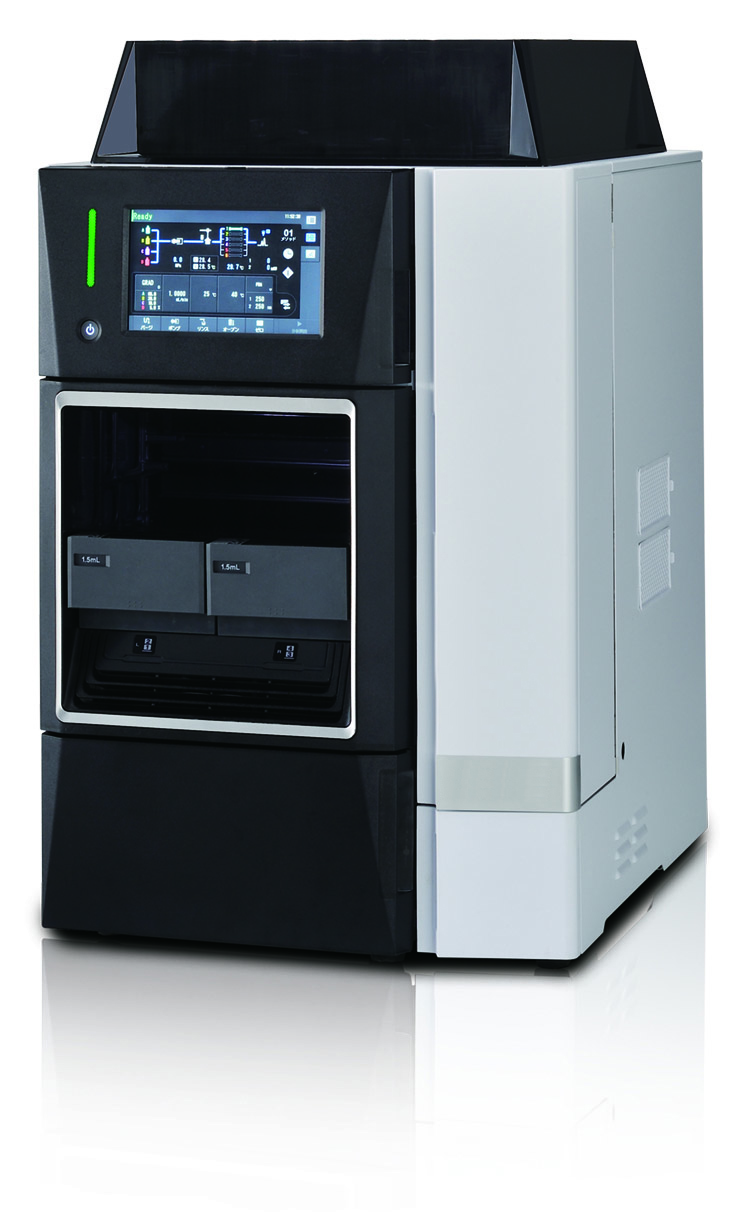
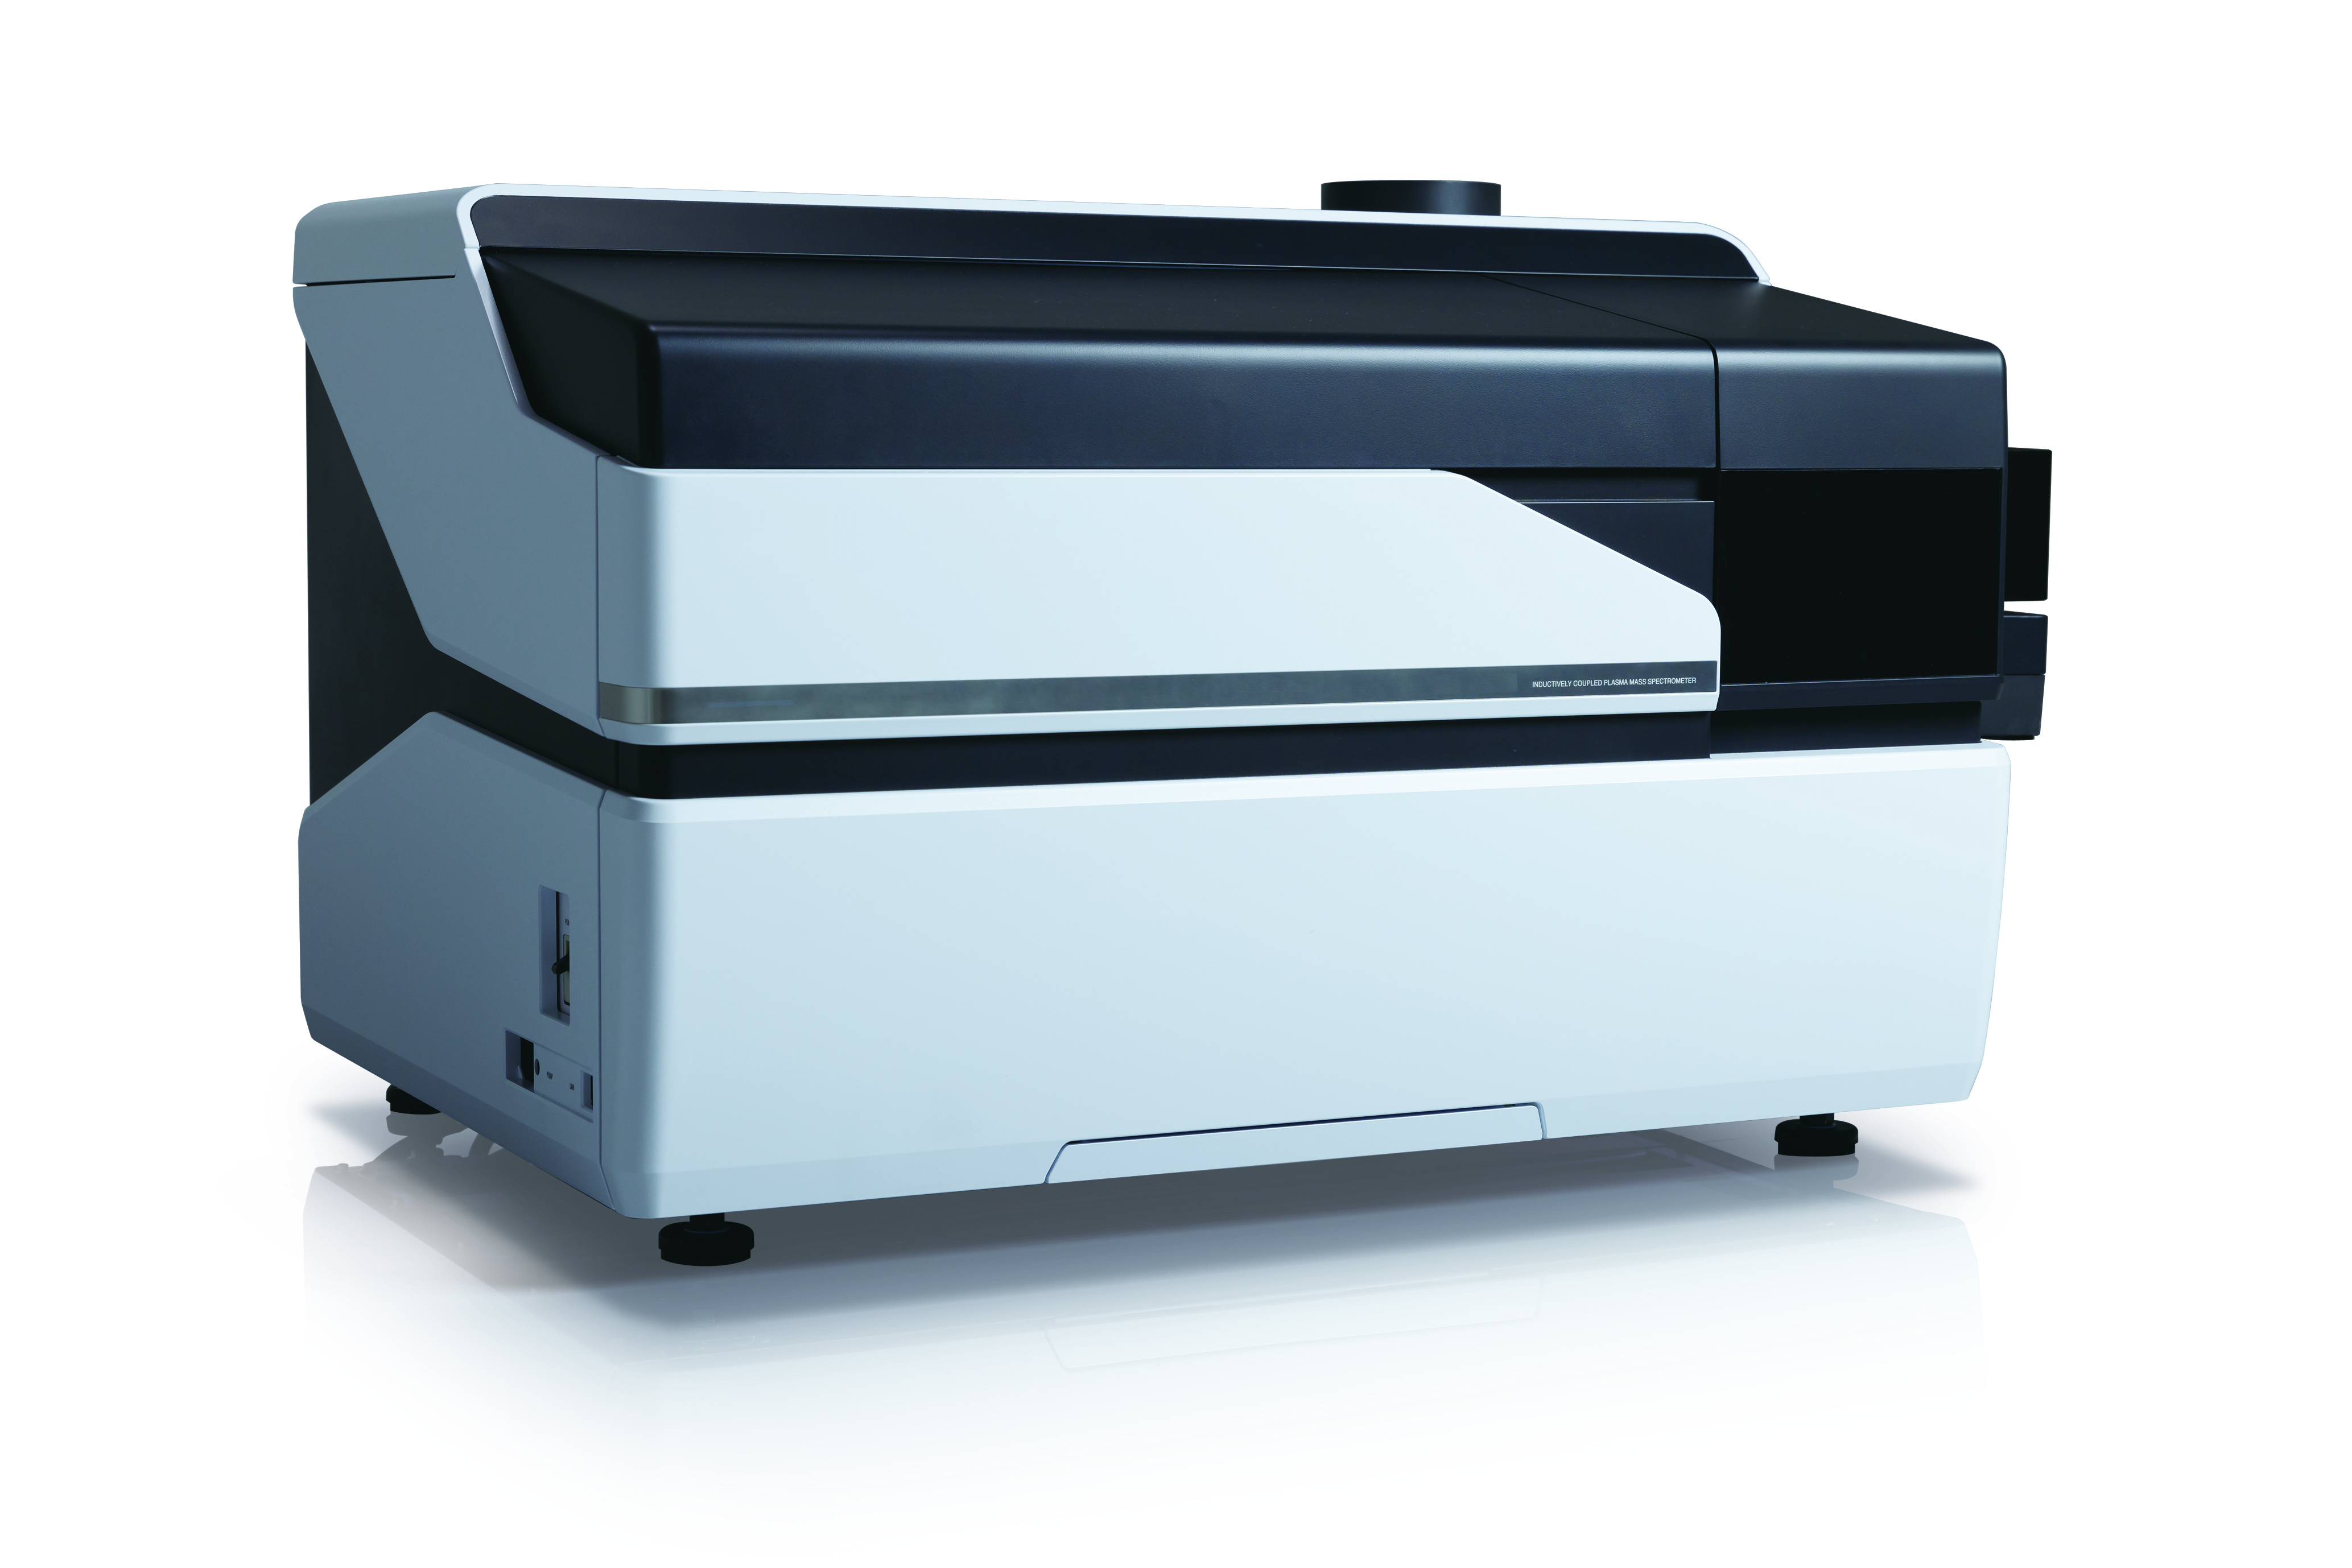
ICP-MS instrument for detecting heavy metals in cannabis.
Different types of metals can be found in soils and fertilizers, and as cannabis plants grow, they tend to draw in these metals from the soil. Heavy metals are a group of metals considered to be toxic, and the most common include lead, cadmium, arsenic and mercury. Most labs are required to test and confirm that samples are under the allowable toxic concentration limits for these four hazardous metals.
Heavy metal testing is performed by inductively coupled plasma mass spectrometry (ICP-MS). ICP-MS uses the different masses of each element to determine which elements are present within a sample and at what concentrations. Make sure to include accompanying software that provides assistant functions to simplify analysis by developing analytical methods and automatically diagnosing spectral interference. This will provide easy operation and analytical results with exceptionally high reliability.
To reduce running costs, look for a supporting hardware system that reduces the consumption of argon gas and electricity. For example, use a plasma ignition sequence that is optimized for lower-purity argon gas (i.e., 99.9% argon as opposed to more expensive 99.9999%).
Pesticide Testing
The detection of pesticides in cannabis can be a challenge. There are many pesticides that are used in commercial cannabis grow operations to kill the pests that thrive on the plants and in greenhouses. These chemicals are toxic to humans, so confirming their absence from cannabis products is crucial. The number of pesticides that must be tested for varies from state to state, with Colorado requiring only 13 pesticides, whereas Oregon and California require 59 and 66 respectively. Canada has taken it a step further and must test for 96 pesticides, while AOAC International is developing methods for testing for 104 pesticides. The list of pesticides will continue to evolve as the industry evolves.
Testing for pesticides is one of the more problematic analyses, possibly resulting in the need for two different instruments depending on the state’s requirements. For a majority of pesticides, liquid chromatography mass spectrometry (LCMS) is acceptable and operates much like HPLC but utilizes a different detector and sample preparation.
With excellent sensitivity and ultra-low detection limits, LC-MS/MS is an ideal technique for the analysis of pesticides.
Pesticides that do not ionize well in an LCMS source require the use of a gas chromatography mass spectrometry (GCMS) instrument. The principles of HPLC still apply – you inject a sample, separate it on a column and detect with a detector. However, in this case, a gas (typically helium) is used to carry the sample.
Look for a LC-MS/MS system or HPLC system with a triple quadrupole mass spectrometer that provides ultra-low detection limits, high sensitivity and efficient throughput. Advanced systems can analyze more than 200 pesticides in 12 minutes.
For GCMS analysis, consider an instrument that utilizes a triple quadrupole mass spectrometer to help maximize the capabilities of your laboratory. Select an instrument that is designed with enhanced functionality, analysis software, databases and a sample introduction system. Also include a headspace autosampler, which can also be used for terpene profiles and residual solvent testing.
Residual Solvent Testing
Residual solvents are chemicals left over from the process of extracting cannabinoids and terpenes from the cannabis plant. Common solvents for such extractions include ethanol, butane, propane and hexane. These solvents are evaporated to prepare high-concentration oils and waxes. However, it is sometimes necessary to use large quantities of solvent in order to increase extraction efficiency and to achieve higher levels of purity. Since these solvents are not safe for human consumption, most states require labs to verify that all traces of the substances have been removed.
Testing for residual solvents requires gas chromatography (GC). For this process, a small amount of extract is put into a vial and heated to mimic the natural evaporation process. The amount of solvent that is evaporated from the sample and into the air is referred to as the “headspace.” The headspace is then extracted with a syringe and placed in the injection port of the GC. This technique is called full-evaporated technique (FET) and utilizes the headspace autosampler for the GC.
Look for a GCMS instrument with a headspace autosampler, which can also be used for pesticide and terpene analysis.
Terpene Profile Testing
Terpenes are produced in the trichomes of the cannabis leaves, where THC is created, and are common constituents of the plant’s distinctive flavor and aroma. Terpenes also act as essential medicinal hydrocarbon building blocks, influencing the overall homeopathic and therapeutic effect of the product. The characterization of terpenes and their synergistic effect with cannabinoids are key for identifying the correct cannabis treatment plan for patients with pain, anxiety, epilepsy, depression, cancer and other illnesses. This test is not required by most states, but it is recommended.
The instrumentation that is used for analyzing terpene profiles is a GCMS with headspace autosampler with an appropriate spectral library. Since residual solvent testing is an analysis required by most states, all of the instrumentation required for terpene profiling will already be in your lab.
As with residual solvent testing, look for a GCMS instrument with a headspace autosampler (see above).
Microbe, Fungus and Mycotoxin Testing
Most states mandate that cannabis testing labs analyze samples for any fungal or microbial growth resulting from production or handling, as well as for mycotoxins, which are toxins produced by fungi. With the potential to become lethal, continuous exposure to mycotoxins can lead to a buildup of progressively worse allergic reactions.
LCMS should be used to qualify and identify strains of mycotoxins. However, determining the amount of microorganisms present is another challenge. That testing can be done using enzyme linked immunosorbent assay (ELISA), quantitative polymerase chain reaction (qPCR) or matrix-assisted laser desorption/ionization time-of-flight mass spectrometry (MALDI-TOF MS), with each having their advantages and disadvantages.
For mycotoxin analysis, select a high-sensitivity LC-MS/MS instrument. In addition to standard LC, using an MS/MS selective detector enables labs to obtain limits of detection up to 1000 times greater than conventional LC-UV instruments.
For qPCR and its associated needs, look for a real-time PCR amplification system that combines thermal cyclers with optical reaction modules for singleplex and multiplex detection of fluorophores. These real-time PCR detection systems range from economical two-target detection to sophisticated five-target or more detection systems. The real-time detection platform should offer reliable gradient-enabled thermal cyclers for rapid assay optimization. Accompanying software built to work with the system simplifies plate setup, data collection, data analysis and data visualization of real-time PCR results.
Moisture Content and Water Activity Testing
Moisture content testing is required in some states. Moisture can be extremely detrimental to the quality of stored cannabis products. Dried cannabis typically has a moisture content of 5% to 12%. A moisture content above 12% in dried cannabis is prone to fungal growth (mold). As medical users may be immune deficient and vulnerable to the effects of mold, constant monitoring of moisture is needed. Below a 5% moisture content, the cannabis will turn to a dust-like texture.
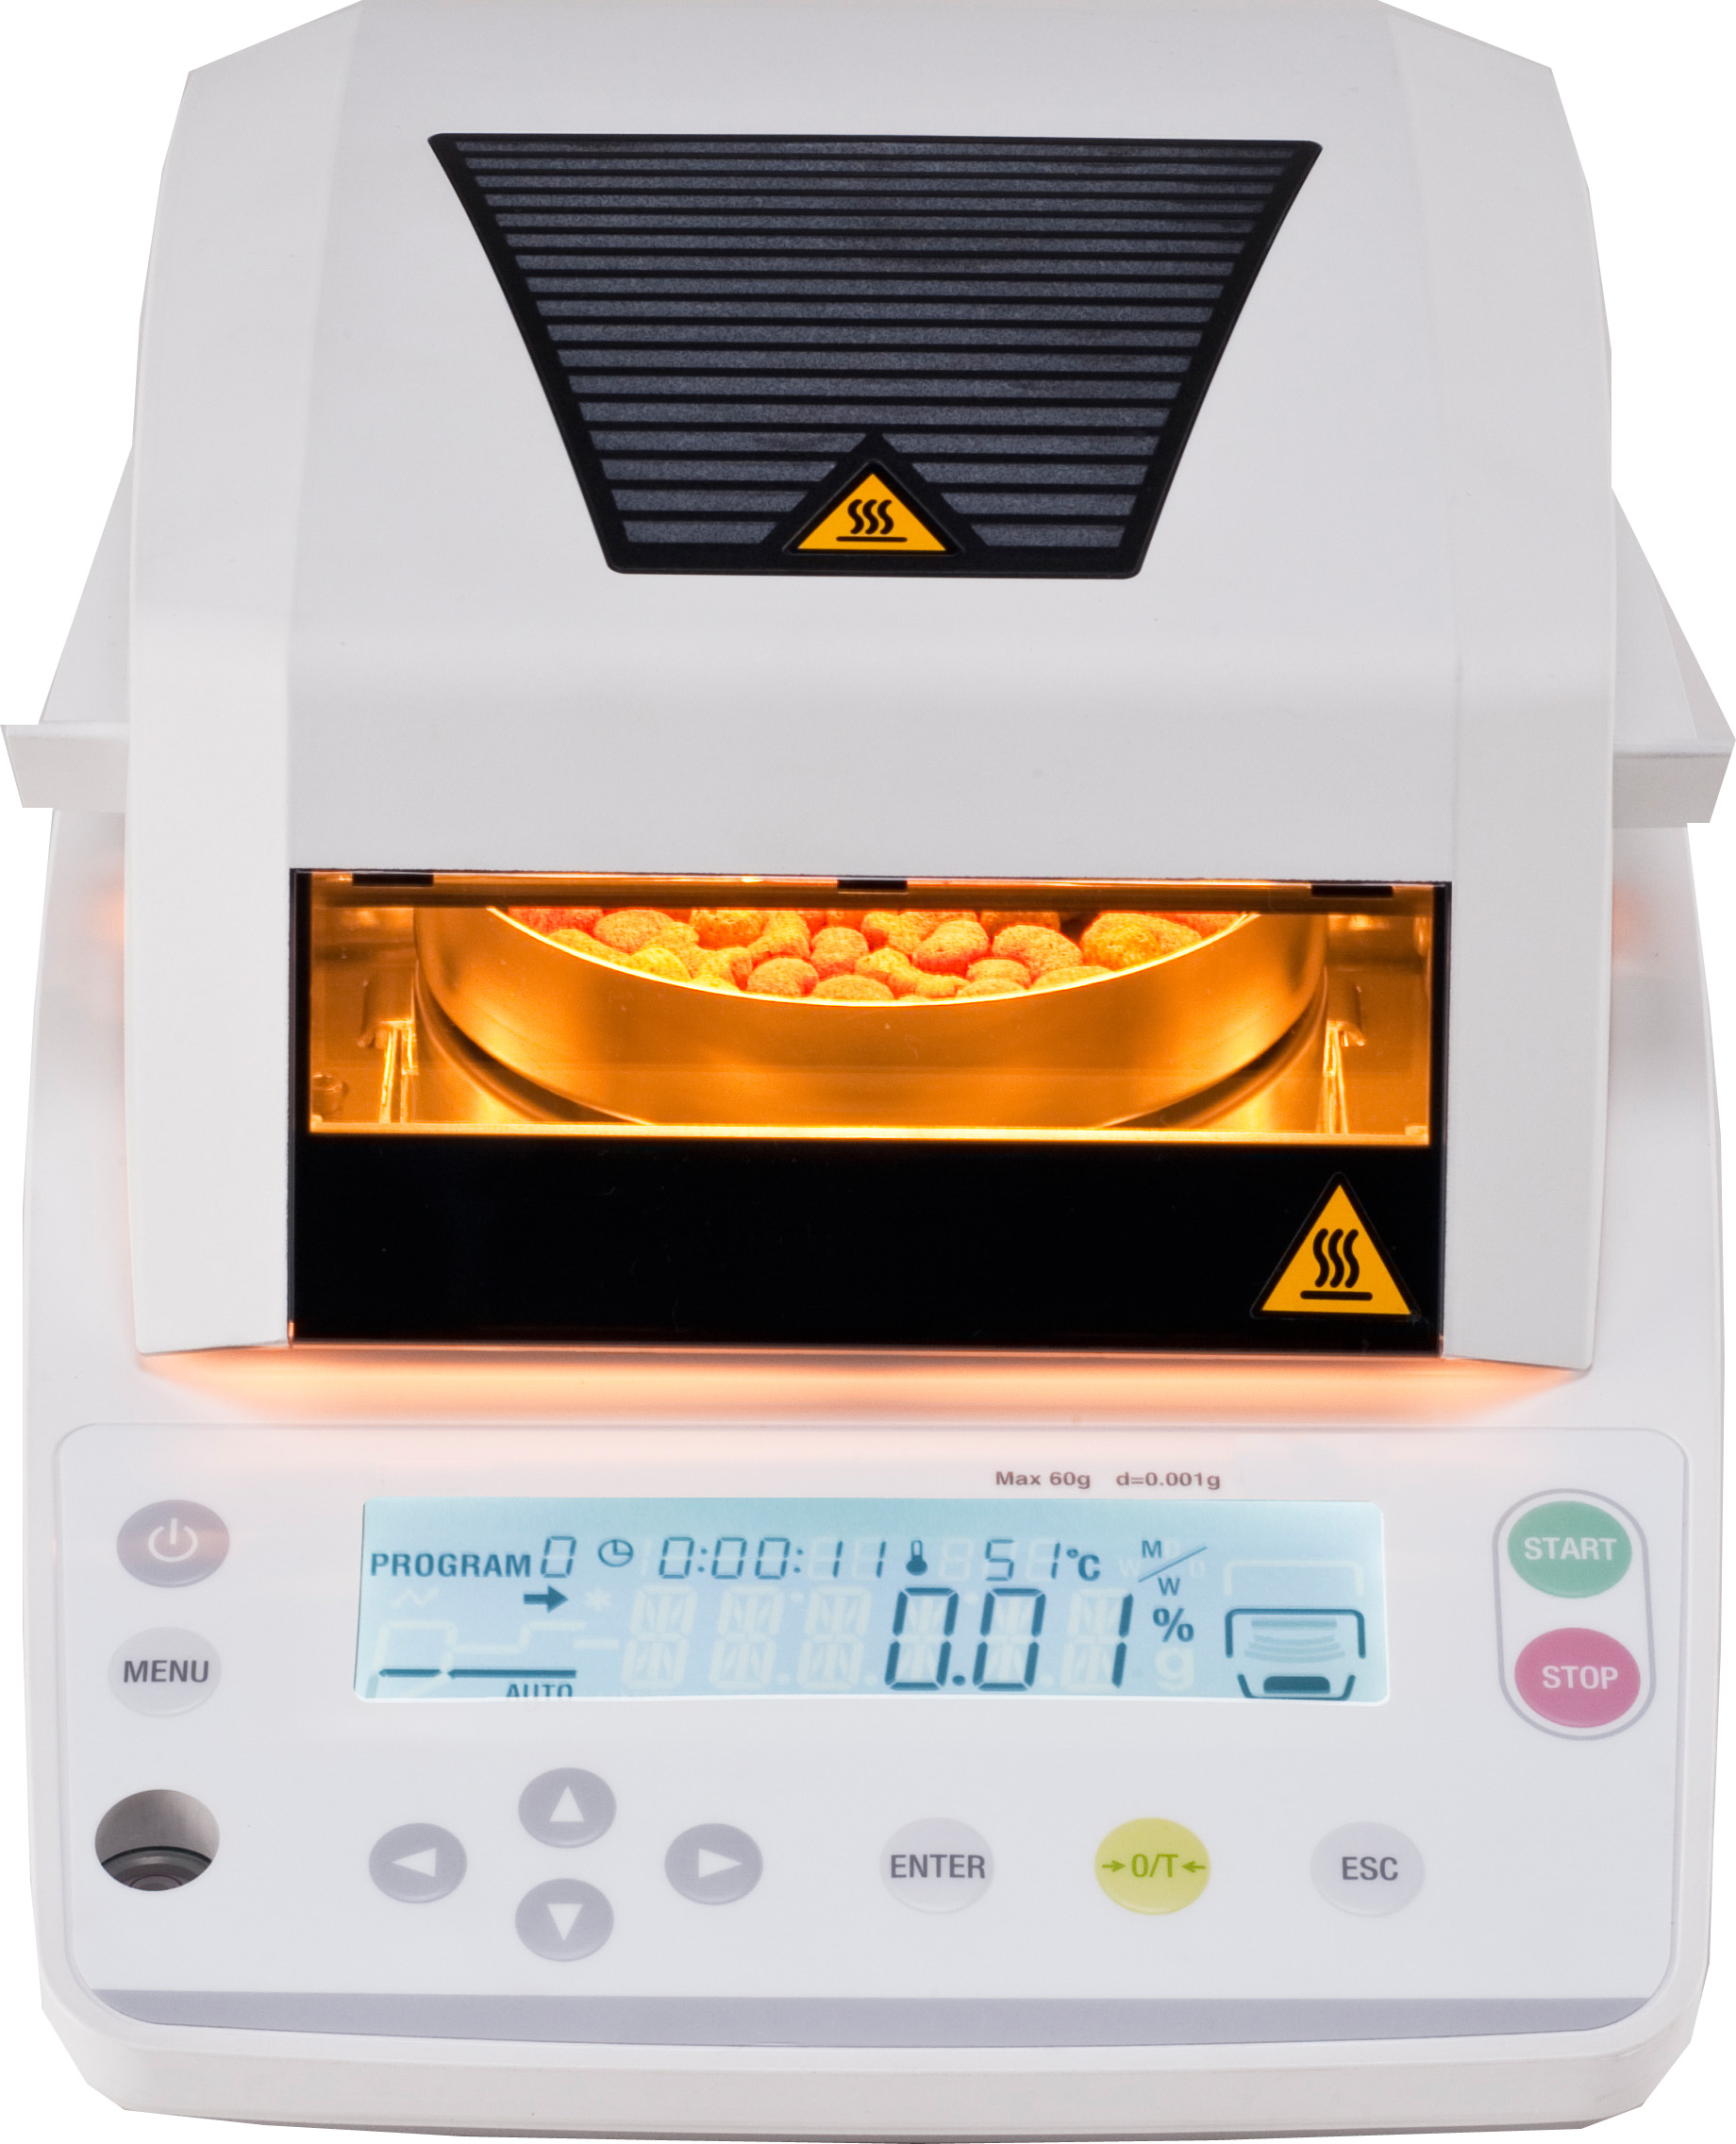
The best way to analyze the moisture content of any product is using the thermogravimetric method with a moisture balance instrument. This process involves placing the sample of cannabis into the sample chamber and taking an initial reading. Then the moisture balance instrument heats up until all the moisture has been evaporated out of the sample. A final reading is then taken to determine the percent weight of moisture that was contained in the original sample.
A moisture balance can provide accurate determination of moisture content in cannabis.
Look for a moisture balance that offers intuitive operation and quick, accurate determination of moisture content. The pan should be spacious enough to allow large samples to be spread thinly. The halogen heater and reflector plate should combine to enable precise, uniform heating. Advanced features can include preset, modifiable measurement modes like automated ending, timed ending, rapid drying, slow drying and step drying.
Another method for preventing mold is monitoring water activity (aW). Very simply, moisture content is the total amount of water available, while water activity is the “free water” that could produce mold. Water activityranges from 0 to 1. Pure water would have an aW of 1.0. ASTM methods D8196-18 and D8297-18 are methods for monitoring water activity in dry cannabis flower. The aW range recommended for storage is 0.55 to 0.65. Some states recommend moisture content to be monitored, other states monitor water activity, and some states such as California recommend monitoring both.
Final Thoughts
As you can see, cannabis growers benefit tremendously from cannabis testing. Whether meeting state requirements or certifying a product, laboratory testing reduces growers’ risk and ensures delivery of a quality product. As medicinal and recreational cannabis markets continue to grow, analytical testing will ensure that consumers are receiving accurately
labeled products that are free from contamination. That’s why it is important to invest in the future of your cannabis testing lab by selecting the right analytical equipment at the start of your venture.
Back in August, Lake Superior State University (LSSU) announced the formation of a strategic partnership with Agilent Technologies to “facilitate education and research in cannabis chemistry and analysis.” The university formed the LSSU Cannabis Center of Excellence (CoE), which is sponsored by Agilent. The facility, powered by top-of-the-line Agilent instrumentation, is designed for research and education in cannabis science, according to a press release.
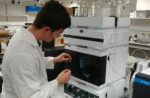
Chemistry student, Justin Blalock, calibrates an Agilent 1290 Ultra-High Pressure Liquid Chromatograph with a 6470 Tandem Mass Spectrometer in the new LSSU Cannabis Center of Excellence, Sponsored by Agilent.
The LSSU Cannabis CoE will help train undergraduate students in the field of cannabis science and analytical chemistry. “The focus of the new LSSU Cannabis CoE will be training undergraduate students as job-ready chemists, experienced in multi-million-dollar instrumentation and modern techniques,” reads the press release. “Students will be using Agilent’s preeminent scientific instruments in their coursework and in faculty-mentored undergraduate research.”
The facility has over $2 million dollars of Agilent instruments including their UHPLC-MS/MS, UHPLC-TOF, GC-MS/MS, LC-DAD, GC/MS, GC-FID/ECD, ICP-MS and MP-AES. Those instruments are housed in a 2600 square-foot facility in the Crawford Hall of Science. In February earlier this year, LSSU launched the very first program for undergraduate students focused completely on cannabis chemistry. With the new facility and all the technology that comes with it, they hope to develop a leading training center for chemists in the cannabis space.
Dr. Steve Johnson, Dean of the College of Science and the Environment at LSSU, says making this kind of instrumentation available to undergraduate studies is a game changer. “The LSSU Cannabis Center of Excellence, Sponsored by Agilent was created to provide a platform for our students to be at the forefront of the cannabis analytics industry,” says Dr. Johnson. “The instrumentation available is rarely paralleled at other undergraduate institutions. The focus of the cannabis program is to provide our graduates with the analytical skills necessary to move successfully into the cannabis industry.”
Storm Shriver is the Laboratory Director at Unitech Laboratories, a cannabis testing lab in Michigan, and sounds eager to work with students in the program. “I was very excited to learn about your degree offerings as there is a definite shortage of chemists who have experience with data analysis and operation of the analytical equipment required for the analysis of cannabis,” says Shriver. “I am running into this now as I begin hiring and scouting for qualified individuals. I am definitely interested in a summer internship program with my laboratory.”
LSSU hopes the new facility and program will help lead the way for more innovation in cannabis science and research. For more information, visit LSSU.edu.
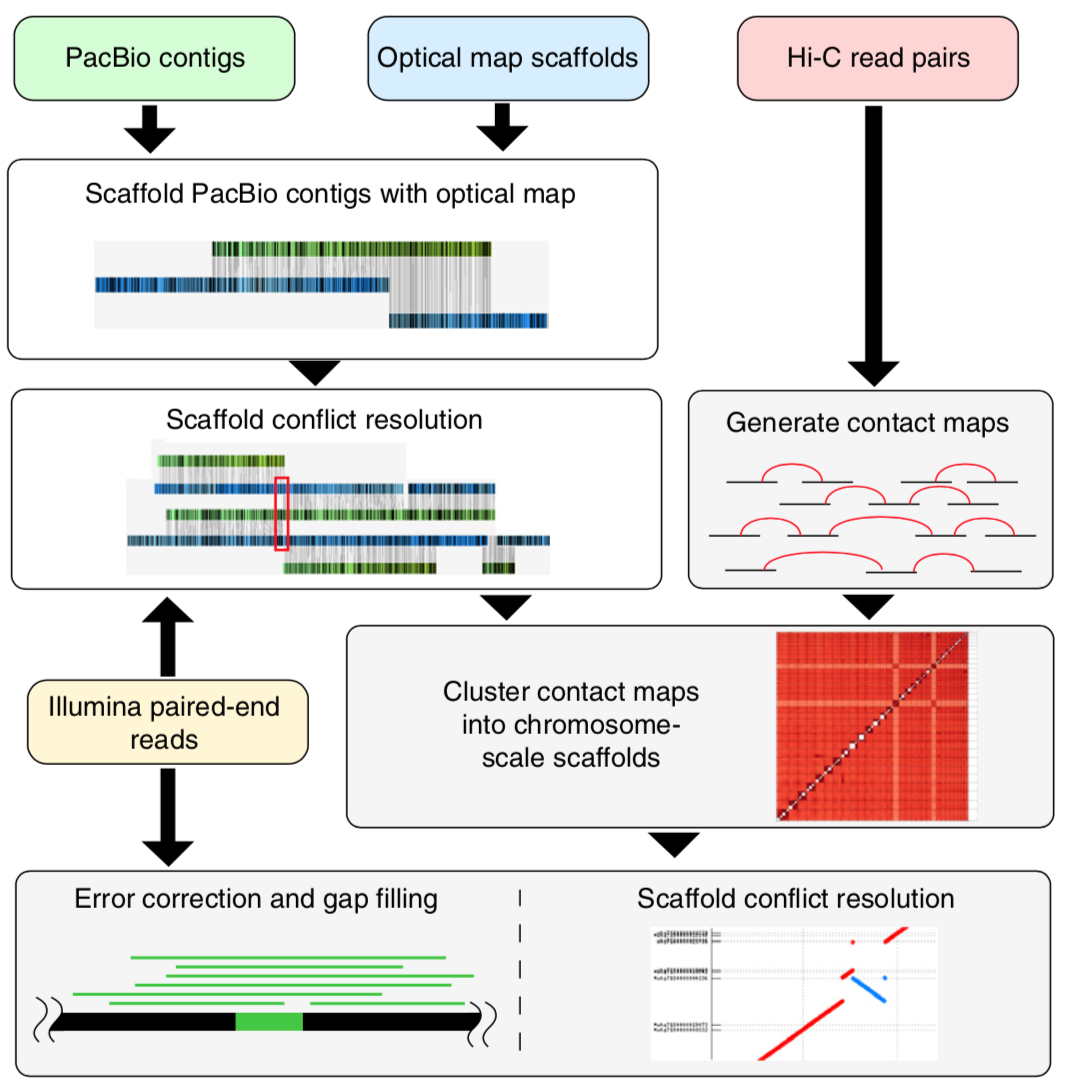
Genome sequencing has made remarkable strides since the initiation of “The Human Genome Project” in 1990. Still, there are many challenges that must be overcome before this methodology can reach its fullest potential and be useful in serving as a method of Cannabis sativa genetics verification and tracking throughout the cannabis supply chain. Several major milestones that must be realized include end-to-end haploid type (single, unpaired set of chromosomes instead of complete paired set or “diploid”), long read, resolved genome sequences at a reasonable cost within a reasonable timeframe and with confidence in accuracy (Mostovoy et al.). These genomes are typically generated as shorter reads that are then scaffolded (Fig 1.) or matched to reference genomes in order to build a longer continuous read. While shorter sequencing reads indeed lower the cost barrier for producing more genomic data, it has created another issue as a result of this short-read technology.
Figure 1: Four sets of sequencing data (long-read WGS, Hi-C, optical mapping, and short-read WGS) were produced to generate the goat reference genome. A tiered scaffolding approach using optical mapping data followed by Hi-C proximity-guided assembly produced the highest-quality genome assembly. (Bickhart et al.)
There are two main issues with the more affordable short read sequencing methodology, the first being that sequential variants are typically not detected, especially if they involve a ton of repeats/inverted repeats, due to the limitation of the current referenced Cannabis genomes and the mapping process of the short-read sequences. This is especially unfortunate because larger variants can have up to a 13% variance within a diploid multichromosomal genome, such as Cannabis sativa, and this variance is thought to largely contribute to disease in various species, or maybe terpene profile in Cannabis sativa. Not being able to detect these variances with more affordable sequencing methodologies is particularly problematic and reference genomes produced with short read sequences are typically highly fragmented. The second limitation is the inherent errors, gaps and other ambiguities associated with taking tons of short read sequences and combining them all, like a jigsaw puzzle, in order to draft the larger genomic picture. While there is software with algorithms to assist in deciphering raw sequences, there is still much more work to be done on this challenge, considering that cannabis genome sequencing is new genomics territory. Unfortunately, as researchers seek higher and higher levels of data quality, shortcomings of this type of sequencing technology begin to become apparent. This sort of sequencing methodology relies heavily on reference sequences. This isn’t much of an issue with microbial genomes, which tend to be rather short and typically have one chromosome, however, when seeking to analyze much longer genomes with multiple diploid chromosomes and tons of mono and dinucleotide repeats, problems arise (English et al.).
Figure 2: Blockchain Digital Stamping Certificate which publicly documents the date and time of the completion of this work. (Mckernan – Crypto Funded Public Genomics)
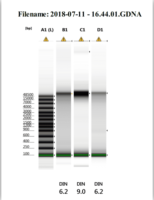
The other category of sequencing is long read sequencing. Long read sequencing is as it sounds, the deciphering of much longer DNA strands. Of course, the technology is limited by the quality of the DNA captured, therefore, special high molecular weight DNA extraction protocols must be deployed in order to obtain the proper DNA quality (Fig. 3). Once this initial limitation is overcome there is the stark cost of long read sequencing technology. PacBio without a doubt makes one of the highest quality long read sequence generating instruments that has ever graced the field of biotechnology, but due to the steep price tag of the machine, progress in this field has been stifled simply because it just isn’t affordable and the read depth for mammalian and plant genomes is currently almost completely prohibitive until read lengths double in length for this instrumentation. In order to produce what is considered to be a “validated genome” both short read and long read sequencing methodologies are combined. Long read sequencing data is used to produce the reference contigs because they are much easier to assemble, then short read sequencing is scaffolded against the reference contigs as a sort of “consensus validation” of the long read contigs.
Figure 3: Depiction of various DNA high molecular weight DNA quality captured during cannabis genome submission project. (Mckernan – Crypto Funded Public Genomics)
Despite the shortcoming of utilizing short read sequencing technology for analysis of the cannabis genome, it is still useful especially when combined with other longer read sequencing technologies or optical mapping technologies. Kevin McKernan, chief scientific officer of Medicinal Genomics, has been working feverishly to bridge the information gap between the cannabis genome and other widely studied plant genomes. As a scientist that worked on the Human Genome Project in 2001, McKernan has a demonstrated history of brilliance in the field of genomics. This paved the way for him to coordinate the first crypto funded and blockchain notarized sequencing project (DASH DAO funded) (Fig. 2), which was completed in 60 days, and surprisingly showed that the cannabis genome is over 1 billion bases long which is 30% larger than any cannabis genome submitted prior to his work. By reaching the standard of 500kb N50 set forth by the Human Genome Project, Kevin McKernan was able to see new aspects of the cannabis genome that were not visible due to the fragmented genomic data previously generated. Information such as a possible linkage of THCA synthase and CBDA synthase genes is crucial when seeking to use the cannabis genome for verification and tracking purposes. This is because special linkages can be considered a type of “genetic marker” that may be used to differentiate cannabis cultivars and lineages. There are many types of genetic markers, including SNP (single nucleotide polymorphisms), VNTR (variable number tandem repeats) and even patterns of gene expression. Funding and recording of cannabis genomics must be further developed in order for potential markers to be identified and validated via larger scale genome-wide association studies.
These technologies, when combined, often reduce the number of scaffolds while increasing the percent of resolved genome by filling in gaps within the drafted genome. Nanopore sequencing is an especially interesting and innovative sequencing technology that is useful in many ways. One of the most powerful uses of this technology is its ability to upgrade the quality of draft and pushed genomes by resolving poorly organized genomes and genomic structure for a fraction of the time and cost of other long read sequencing platforms (Jian et al.), making it an excellent candidate for solving cost and time constraints. Nanopore’s portability and convenience makes it a real-time solution to solving genetics-based problems and questions. A notable use of this technology is recorded during an epidemiological outbreak in Africa, its proof of concept in pathogen detection in space, and its ability to detect base modifications during sequencing process. Even still there are more uses to this exciting technology and it has the potential to elevate cannabis genomics and the field of genomics entirely, while remaining portable and expeditious. A shortcoming of the Nanopore sequencing platform is its low sequencing coverage, which makes this platform inefficient for applications like haplotype phasing and single nucleotide variant detection due to the number of variants to be detected being smaller than the published variant-detection error rates of algorithms using MinION data. Single nucleotide variants can be considered to be genetic markers, especially markers for disease, so this is what inhibits Nanopore from resolving our cannabis genome sequencing problems, as of today.
There are genetic markers to discover, molecular biology protocols to optimize, and industry wide potential for exciting collaborationMany algorithmic problems seem to occur due to input data quality. Typical input data quality suffers as the reads get longer and the sequencing depth gets shorter, resulting in not enough data being generated by the sequencing to provide confidence in the genome assembly. To mitigate this, scientists may decide to fractionate a genome, sequence it, or they may clone a difficult to sequence region with highly repetitive regions in order to produce reads with greater depth and thus resolve the region. They can then perform single molecule sequencing to resolve genome structure then determine and confirm the place of the cloned region. Thus, it seems that the best solution to the limitation of algorithms is to be aware of sequencing platform limitations and compensate for these limitations by using more than one sequencing platform to obtain enough pertinent data to confidently produce authentic, “validated” genome assemblies (Huddleston et al.). With input data being critical in producing accurate sequencing data, standardization of DNA isolation protocols, extraction reagents and any enzymes utilized may be deemed necessary.
To conclude, the field of cannabis genomics is teeming with opportunities. There are genetic markers to discover, molecular biology protocols to optimize, and industry wide potential for exciting collaboration. More states will need to take into account the lack of federal government research grant availability and begin to think of creative ways to get cannabis science funds to continue the development of this industry. Specifically speaking, developing a feasible method for genetic tracking of cannabis plants will require improvements within the availability of sequencing technology, improvements in deploying the resources to these projects in order for them to be completed expeditiously, and standardization/validation of methods and SOPs used in order to increase confidence in the accuracy of the data generated.
A special thank you to all of my cannabis industry mentors that have molded and elevated my understanding of current needs and applied technologies within the cannabis industry, without you there would be no career within this industry for me. You are immensely appreciated.
Citations
Bickhart, D. M., Rosen, B. D., Koren, S., Sayre, B. L., Hastie, A. R., Chan, S., . . . Smith, T. P. (2017). Single-molecule sequencing and chromatin conformation capture enable de novo reference assembly of the domestic goat genome. Nature Genetics,49(4), 643-650. doi:10.1038/ng.3802
English, A. C., Salerno, W. J., Hampton, O. A., Gonzaga-Jauregui, C., Ambreth, S., Ritter, D. I., . . . Gibbs, R. A. (2015). Assessing structural variation in a personal genome—towards a human reference diploid genome. BMC Genomics,16(1). doi:10.1186/s12864-015-1479-3
Huddleston, J., Ranade, S., Malig, M., Antonacci, F., Chaisson, M., Hon, L., . . . Eichler, E. E. (2014). Reconstructing complex regions of genomes using long-read sequencing technology. Genome Research,24(4), 688-696. doi:10.1101/gr.168450.113
Jain, M., Olsen, H. E., Paten, B., & Akeson, M. (2016). The Oxford Nanopore MinION: Delivery of nanopore sequencing to the genomics community. Genome Biology,17(1). doi:10.1186/s13059-016-1103-0
Mostovoy, Y., Levy-Sakin, M., Lam, J., Lam, E. T., Hastie, A. R., Marks, P., . . . Kwok, P. (2016). A hybrid approach for de novo human genome sequence assembly and phasing. Nature Methods,13(7), 587-590. doi:10.1038/nmeth.3865
Ultimately, the goal of any good company is to take care of their customers by providing a quality product at a competitive price. You take the time to use good practices in sourcing raw materials, processing, testing and packaging to make sure you have a great final product. Yet in practice, sometimes the product can degrade over time, or you find yourself facing costly manufacturing stoppages and repairs due to downed equipment or instrumentation. This can harm your company’s reputation and result in real, negative effects on your bottom line.
One thing you can do to prevent this problem is to have a properly scaled calibration and maintenance program for your organization.
First, a short discussion of terms:
Figure 1– Periodic calibration of an electronic balance performed using traceable standard weights helps to ensure that the balance remains within acceptable operating ranges during use and helps identify problems.
Calibration, in the context of this article, refers to the comparison of the unit under test (your equipment) to a standard value that is known to be accurate. Equipment readings often drift over time due to various reasons and may also be affected by damage to the equipment. Periodic calibration allows the user to determine if the unit under test (UUT) is sufficiently accurate to continue using it. In some cases, the UUT may require adjustment or may not be adjustable and should no longer be used.
Maintenance, in the context of this article, refers to work performed to maximize the performance of equipment and support a long life span for the equipment. This may include lubrication, adjustments, replacement of worn parts, etc. This is intended to extend the usable life of the equipment and the consistency of the quality of the work performed by the equipment.
There are several elements to putting together such a program that can help you to direct your resources where they will have the greatest benefit. The following are some key ingredients for a solid program:
Keep it Simple: The key is to scale it to your operation. Focus on the most important items if resources are strained. A simple program that is followed and that you can defend is much better than a program where you can never catch up.
Written Program: Your calibration and maintenance programs should be written and they should be approved by quality assurance (QA). Any program should include the following:
Equipment Assessment and Identification: Assess each piece of equipment or instrument to determine if it is important enough to be calibrated and/or requires maintenance. You will probably find much of your instrumentation is not used for a critical purpose and can be designated as non-calibrated. Each item should have an ID assigned to allow tracking of the maintenance and/or calibration status.
Scheduling System: There needs to be some way to schedule when equipment is due for calibration or maintenance. This way it is easy to stay on top of it. A good scheduling system will pay for itself over time and be easy to use and maintain. A web-based system is a good choice for small to mid-sized companies.
Calibration Tolerance Assignment: If you decide to calibrate an instrument, consider what kind of accuracy you actually need from the equipment/instrument. This is a separate discussion on its own, but common rule of thumb is that the instrument should be at least 4 times more accurate than your specification. For very important instruments, it may require spending the money to get a better device.
Calibration and Maintenance Interval Assignments: Consider what interval you are going to perform maintenance for each equipment item. Manufacturer recommendations are based on certain conditions. If you use the equipment more or less often than “normal” use, consider adjusting the interval between calibrations or maintenance.
OOT Management: If you do get an Out of Tolerance (OOT) result during a calibration and you find that the instrument isn’t as accurate as you need. Congratulations! You just kept it from getting worse. Review the history and see if this may have had an effect since the last passing calibration, adjust or replace the instrument, take any other necessary corrective actions, and keep it up.
Figure 2- Maintenance engineers help keep your systems running smoothly and within specification for a long, trouble-free life.
Training: Make sure personnel that use the equipment are trained on its use and not to use equipment that is not calibrated for critical measurements. Also, anyone performing calibration and/or maintenance should be qualified to do so. It is best to put a program in place as soon as you start acquiring significant equipment so that you can keep things running smoothly, avoid costly repairs and quality control problems. Don’t fall into the trap of assuming equipment will keep running just because it has run flawlessly for months or years. There are many bad results that can come of mismanaged calibration and/or maintenance including the following:
Unscheduled Downtime/Damage/Repairs: A critical piece of equipment goes down. Production stops, and you are forced to schedule repairs as soon as possible. You pay premium prices for parts and labor, because it is an urgent need. Some parts may have long lead times, or not be available. You may suffer reputational costs with customers waiting for delivery. Some calibration issues could potentially affect operator safety as well.
Out of Specification Product: Quality control may indicate that product is not maintaining its historically high quality. If you have no calibration and maintenance program in place, tracking down the problem is even more difficult because you don’t have confidence in the readings that may be indicating that there is a problem.
Root Cause Analysis: Suppose you find product that is out of specification and you are trying to determine the cause. If there is no calibration and maintenance program in place, it is far more difficult to pinpoint changes that may have affected your production system. This can cause a very significant impact on your ability to correct the problem and regain your historical quality standards of production.
A solid calibration and maintenance program can go a long way to keeping your production lines and quality testing “boring”, without any surprises or suspense, and can allow you to put more sophisticated quality control systems in place. Alternatively, an inappropriate system can bog you down with paperwork, delays, unpredictable performance, and a host of other problems. Take care of your equipment and relax, knowing your customers will be happy with the consistent quality that they have become accustomed to.
This website uses cookies so that we can provide you with the best user experience possible. Cookie information is stored in your browser and performs functions such as recognising you when you return to our website and helping our team to understand which sections of the website you find most interesting and useful.
Strictly Necessary Cookies
Strictly Necessary Cookie should be enabled at all times so that we can save your preferences for cookie settings.
We use tracking pixels that set your arrival time at our website, this is used as part of our anti-spam and security measures. Disabling this tracking pixel would disable some of our security measures, and is therefore considered necessary for the safe operation of the website. This tracking pixel is cleared from your system when you delete files in your history.
We also use cookies to store your preferences regarding the setting of 3rd Party Cookies.
If you disable this cookie, we will not be able to save your preferences. This means that every time you visit this website you will need to enable or disable cookies again.