Tag Archives: GC

Terpene_KAS2
From The Lab

The Other Side of Cannabis: Terpenes

By Dr. Zacariah Hildenbrand, Allegra Leghissa, Dr. Kevin A. Schug
2 Comments
Terpene_KAS2

Have you ever wondered why all beers have that strong, characteristic smell? Or why you could tell the smell of cannabis apart from any other plant? The answer is simple – terpenes.

These 55,000 different molecules are responsible for a majority of the odors and fragrances around us, from a pine forest, to the air diffuser in your house 1–3. They all share the same precursor, isoprene, and because of that, they are all related and have similar molecular structures. Unfortunately, it is this uncanny similarity that makes their analysis so challenging; we still lack a complete list of which terpenes expected to be found in each given plant species 1,2.

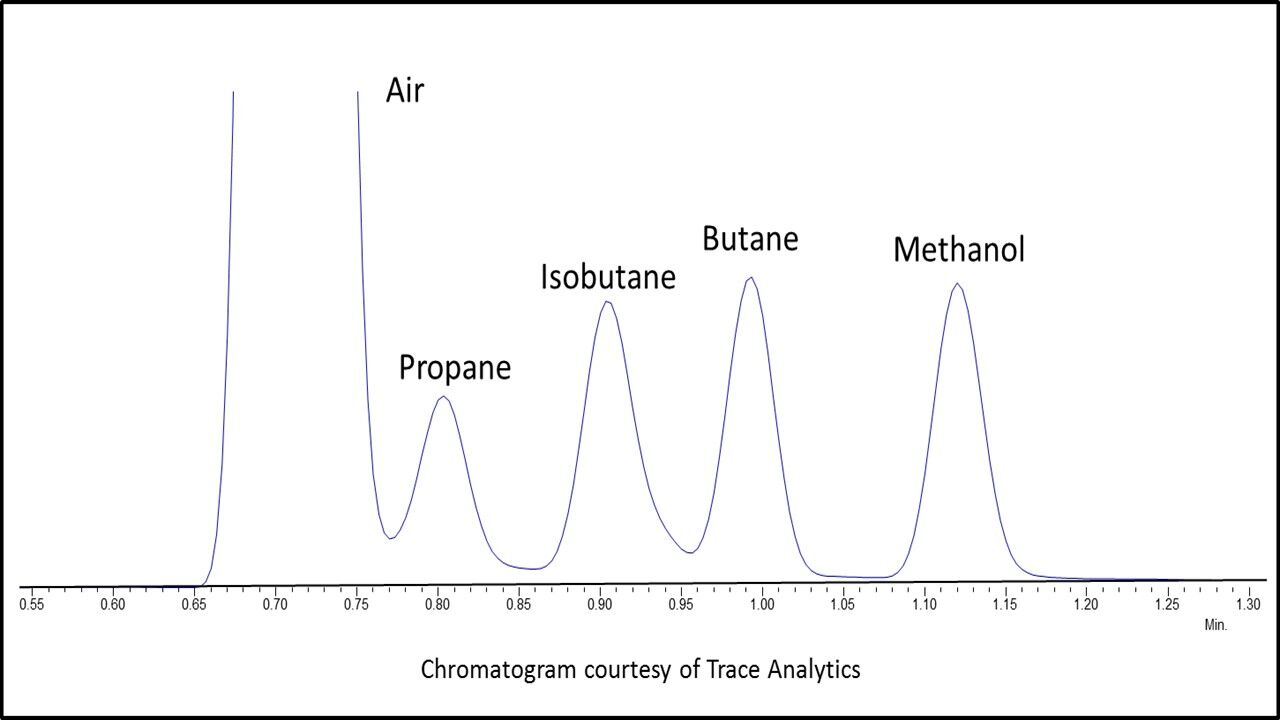
Many different methods have been developed in an effort to provide a time-optimized and straightforward analysis. Gas chromatography (GC) is usually center stage due to the volatility of the terpenes. Therefore, there is significant concern with the type of GC detector used 2.

The flame ionization detector (FID) is a good quantitative detector for GC, but qualitatively it does not provide any information, except for retention time; the differentiation between terpene species is achieved solely by use of retention indices (RI), which are based on elution times from a particular GC stationary phase. The best part of the FID is its low cost, reliability, and relatively easy interface, which make it an effective tool for quality control (QC) but less so with respect to research and discovery 2.

The primary choice for a research setting is the mass spectrometer (MS) detector. It is more expensive and complicated than FID, but importantly, it provides both good quantitative capabilities, and it provides mass spectra for each species that elutes from the chromatograph. However, for terpene analysis, it may still not be the best detector choice. Since terpene class molecules share many structural and functional similarities, even their fragmentation and sub-sequential identification by MS may lead to inconsistent results, which need to be confirmed by use of RI. Still, MS is a better qualitative analysis tool than the FID, especially for distinguishing non-isobaric terpenes 2.

Recently, new technology based on vacuum ultraviolet spectroscopy (VUV) has been developed as a new GC detector. The VUV detector enables analysis of virtually all molecules; virtually all chemical compounds absorb light in the range in the 125-240 nm wavelength range probed by the detector, making it an essentially universal detector 4–11. Previously, spectroscopic absorption detectors for GC have lacked sufficient energy to measure absorption of most GC-amenable species. The VUV detector fills a niche, which is complementary to MS detection in terms of the qualitative information it provides.

Terpene_KAS2
Figure 1: A, Section of the chromatographic separation of a terpenes standard mix; B, highlight of the co-eluting terpenes, camphor and (-)-isopulegol; C, differences in the absorbance spectra of camphor and (-)-isopulegol.

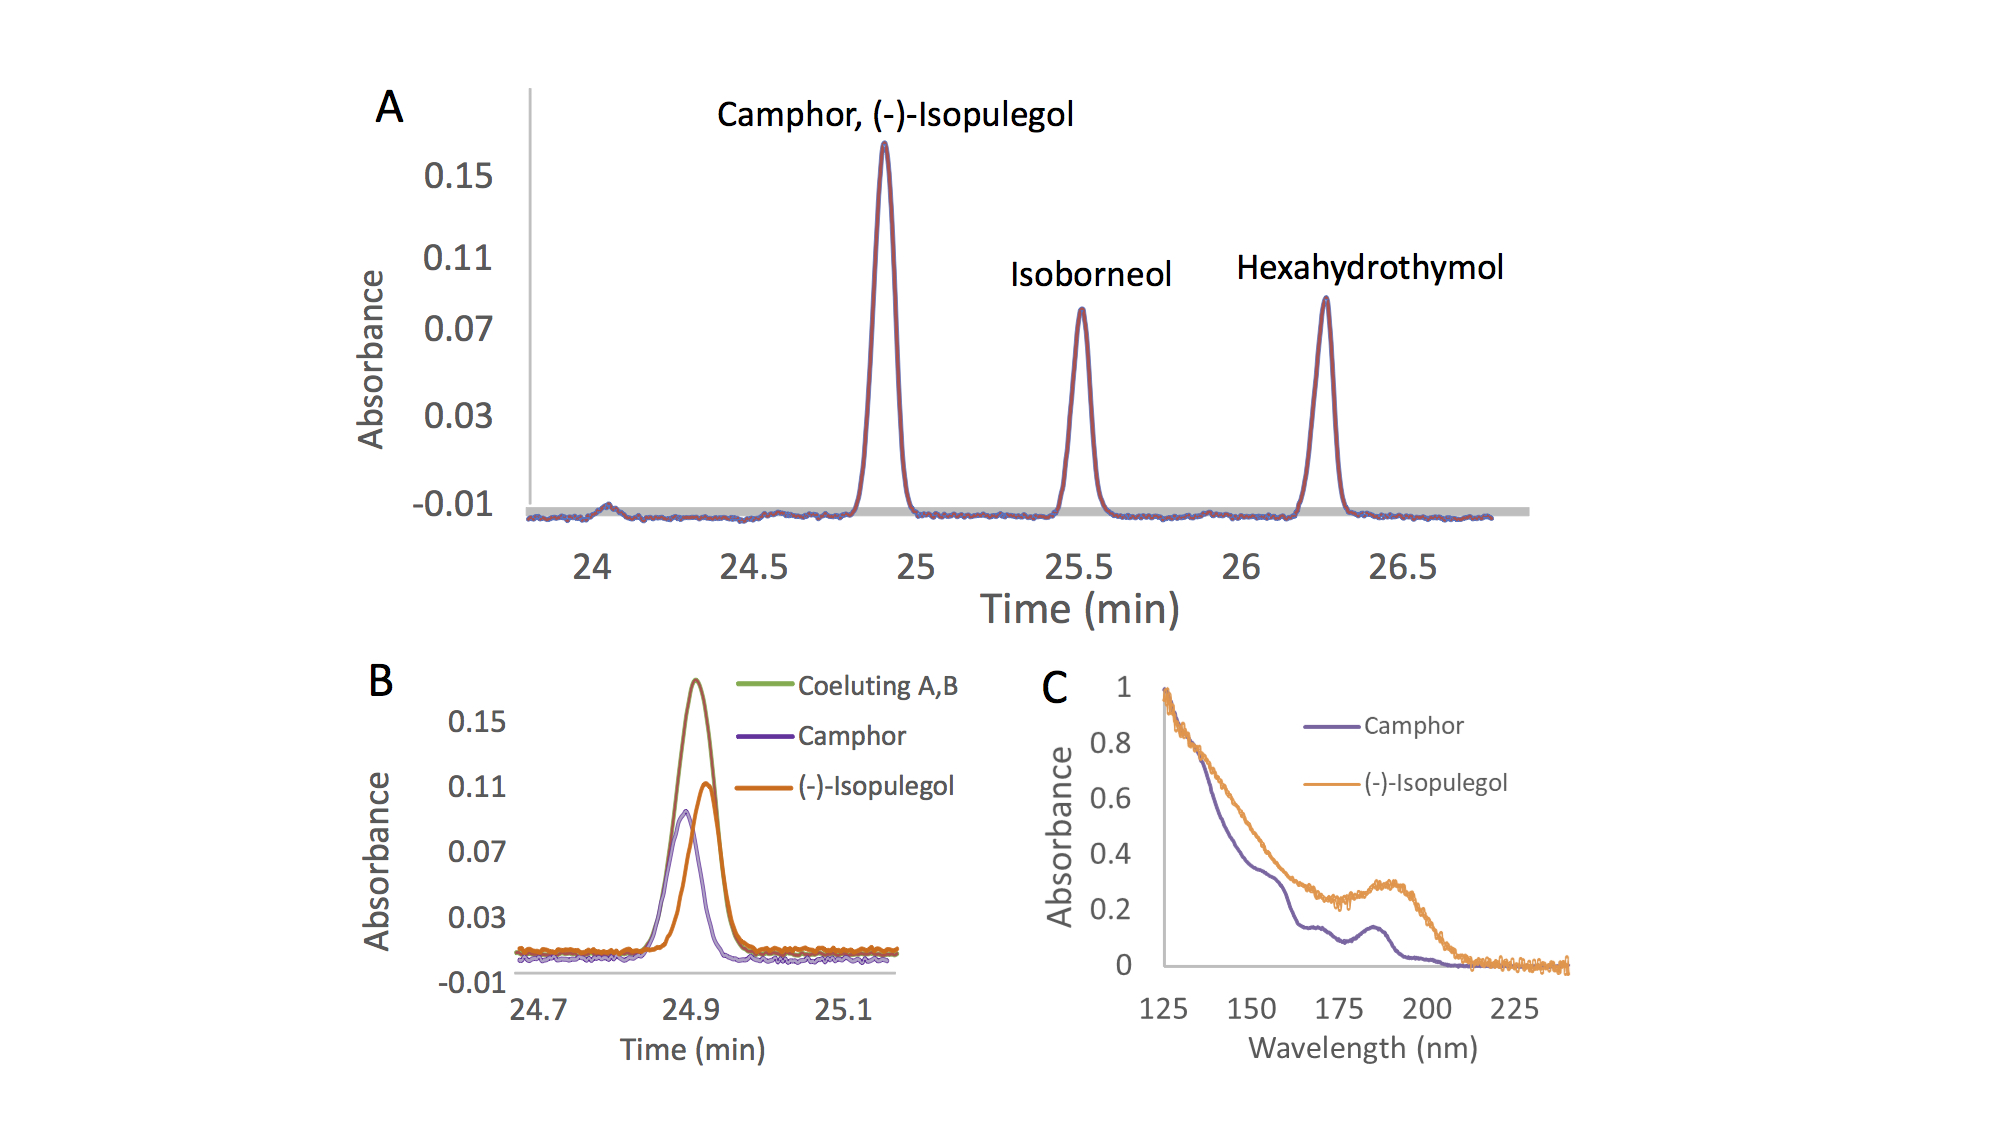
With the VUV detector, each compound exhibits its own unique absorbance spectrum. Even isomers and isobars, which are prevalent in terpene mixtures and can be difficult to distinguish different species by their electron ionization mass spectra, can be well differentiated based on their VUV spectra 6,9,10.  Nevertheless, because analytes exhibit different spectra, it is not required to achieve a perfect chromatographic separation of the mixture components. Co-eluting peaks can be separated post-run through the use of library spectra and software inherent to the instrument 4,10. This ability is called “deconvolution”, and it is based on the fact that two co-eluting terpenes will give a peak with an absorbance spectrum equal to the sum of the two single absorbance spectra 4. Figure 1 shows the deconvolution process for two co-eluting terpenes, camphor and (-)-isopulegol. Due to their different absorbance spectra (Figure 1C), it is possible to fully separate the two peaks in post-run, obtaining sharp peaks for both analytes 6.

The deconvolution process has been shown to yield precise and accurate results. Thus, chromatographic resolution can be sacrificed in favor of spectroscopic resolution; this enables the development of methods with faster run times. With the ability to deconvolve unresolved peaks, a long temperature ramp to chromatographically separate all isomeric terpenes is not required 6. Additionally, the presence of coeluting components, which might normally go undetected with some GC detectors, can be easily judged based on comparison of the measured spectra with pure reference spectra contained in the VUV spectral library.

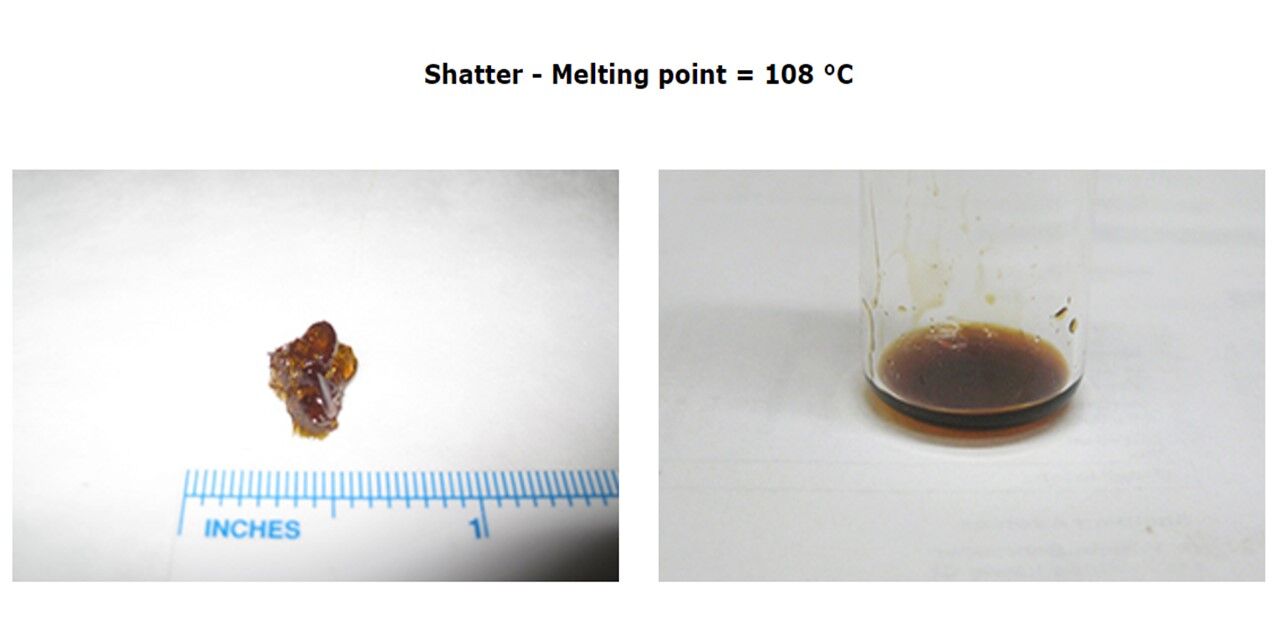
The other issue in terpenes analysis is the extraction process. Terpenes can be extracted with the use of solvents (e.g., methanol, ethanol, hexane, and cyclohexane, among others), but the process is usually time-consuming, costly and not so environmentally-friendly 2. The plant needs to be manually crushed and then aliquots of solvent are used to extract components from the plant, ideally at least 3 times and combined to achieve acceptable results. The problem is that some terpenes may respond better to a certain solvent, making their extraction easier and more optimized than for others 2. The choice of solvent can cause discrimination against the extraction some terpenes, which limits the comprehensiveness of analysis.

Headspace is another technique that can be used for the sample preparation of terpenes. Headspace sampling is based on heating the solid or liquid sample inside a sealed vial, and then analyzing the air above it after sufficient equilibration. In this way, only volatile analytes are extracted from the solid/liquid sample into the gas phase; this allows relatively interference-free sampling 12–14.

How do we know whether our extraction analysis methods are correct and comprehensive for a certain plant sample? Unfortunately, there is not a complete list of available molecules for each plant species, and even if two specimens may smell really similar to our nose, their terpenes profiles may be notably different. When working with a new plant material, it is difficult to predict the extraction efficiency for the vast array of terpenes that may be present. We can only perform it with different extraction and detection methods, and compare the results.

The route for a comprehensive and fast analysis of terpenes is therefore still long; however, their intoxicating aromas and inherent medicinal value has provided a growing impetus for researchers around the world. Considering the evolving importance of Cannabis and the growing body of evidence on the synergistic effects between terpenes and cannabinoids, it is likely that newly improved extraction and analysis methods will be developed, paving the way for a more complete list of terpene species that can be found in different cultivars. The use of new analytical technologies, such as the VUV detector for GC, should aid considerably in this endeavor.


References:

[1]          Breitmaier E., Terpenes: Flavors, Fragrances, Pharmaca, Pheromones. John Wiley & Sons 2006.

[2]          Leghissa A., Hildenbrand Z. L., Schug K. A., A Review of Methods for the Chemical Characterization of Cannabis Natural Products. J. Sep. Sci.2018, 41, 398–415 .

[3]          Benvenuto E., Misra B. B., Stehle F., Andre C. M., Hausman J.-F., Guerriero G., Cannabis sativa: The Plant of the Thousand and One Molecules. Front. Plant Sci2016, 719, DOI: 10.3389/fpls.2016.00019.

[4]          Schug K. A., Sawicki I., Carlton D. D., Fan H.,Mcnair H. M.,Nimmo J. P., Kroll P.,Smuts J.,Walsh P., Harrison D., Vacuum Ultraviolet Detector for Gas Chromatography. Anal. Chem.2014, 86, 8329–8335 .

[5]          Fan H.,Smuts J., Walsh P.,Harrison D., Schug K. A., Gas chromatography-vacuum ultraviolet spectroscopy for multiclass pesticide identification. J. Chromatogr. A2015, DOI: 10.1016/j.chroma.2015.02.035.

[6]          Qiu C.,Smuts J., Schug K. A., Analysis of terpenes and turpentines using gas chromatography with vacuum ultraviolet detection. J. Sep. Sci.2017, 40, 869–877 .

[7]          Leghissa A., Smuts J., Qiu C., Hildenbrand Z. L., Schug K. A., Detection of cannabinoids and cannabinoid metabolites using gas chromatography-vacuum ultraviolet spectroscopy. Sep. Sci. Plus2018, 1.

[8]          Bai L.,Smuts J., Walsh P., Fan H., Hildenbrand Z., Wong D., Wetz D., Schug K. A., Permanent gas analysis using gas chromatography with vacuum ultraviolet detection. J. Chromatogr. A2015,1388, 244–250 .

[9]          Skultety L., Frycak P., Qiu C.,Smuts J., Shear-Laude L., Lemr K., Mao J. X., Kroll P., Schug K. A., Szewczak A., Vaught C., Lurie I., Havlicek V., Resolution of isomeric new designer stimulants using gas chromatography – Vacuum ultraviolet spectroscopy and theoretical computations. Anal. Chim. Acta2017, 971, 55–67 .

[10]       Bai L., Smuts J., Walsh P., Qiu C., McNair H. M., Schug K. ., Pseudo-absolute quantitative analysis using gas chromatography–vacuum ultraviolet spectroscopy–a tutorial. Anal. Chim. Acta2017, 953, 10–22 .

[11]       Schenk J., Nagy G., Pohl N. L. B., Leghissa A., Smuts J., Schug K. A., Identification and deconvolution of carbohydrates with gas chromatography-vacuum ultraviolet spectroscopy. J. Chromatogr. A2017, 1513, 210–221 .

[12]       Van Opstaele F., De Causmaecker B., Aerts G., De Cooman L., Characterization of novel varietal floral hop aromas by headspace solid phase microextraction and gas chromatography-mass spectrometry/olfactometry. J. Agric. Food Chem.2012, 60, 12270−12281 .

[13]       Hamm S., Bleton J., Connan J., Tchapla A., A chemical investigation by headspace SPME and GC-MS of volatile and semi-volatile terpenes in various olibanum samples. Phytochemistry2005,66, 1499–1514 .

[14]       Aberl A., Coelhan M., Determination of volatile compounds in different hop Varieties by headspace-trap GC/MS-in comparison with conventional hop essential oil analysis. J. Agric. Food Chem.2012, 60, 2785−2792 .

Multi-analyte Configuration for Cannabis Testing Services

Managing Cannabis Testing Lab Workflows using LIMS

By Dr. Susan Audino
No Comments
Multi-analyte Configuration for Cannabis Testing Services

With the state led legalization of both adult recreational and medical cannabis, there is a need for comprehensive and reliable analytical testing to ensure consumer safety and drug potency. Cannabis-testing laboratories receive high volumes of test requests from cannabis cultivators for testing quantitative and qualitative aspects of the plant. The testing market is growing as more states bring in stricter enforcement policies on testing. As the number of testing labs grow, it is anticipated that the laboratories that are now servicing other markets, including high throughput contract labs, will cross into cannabis testing as regulations free up. As the volume of tests each lab performs increases, the need for laboratories to make effective use of time and resource management, such as ensuring accurate and quick results, reports, regulatory compliance, quality assurance and many other aspects of data management becomes vital in staying competitive.

Cannabis Testing Workflows

To be commercially competitive, testing labs offer a comprehensive range of testing services. These services are available for both the medical and recreational cannabis markets, including:

  • Detection and quantification of both acid and neutral forms of cannabinoids
  • Screening for pesticide levels
  • Monitoring water activity to indicate the possibility of microbiological contamination
  • Moisture content measurements
  • Terpene profiling
  • Residual solvents and heavy metal testing
  • Fungi, molds, mycotoxin testing and many more

Although the testing workflows differ for each test, here is a basic overview of the operations carried out in a cannabis-testing lab:

  1. Cannabis samples are received.
  2. The samples are processed using techniques such as grinding and homogenization. This may be followed by extraction, filtration and evaporation.
  3. A few samples will be isolated and concentrated by dissolving in solvents, while others may be derivatized using HPLC or GC reagents
  4. The processed samples are then subjected to chromatographic separation using techniques such as HPLC, UHPLC, GC and GC-MS.
  5. The separated components are then analyzed and identified for qualitative and quantitative analysis based on specialized standards and certified reference materials.
  6. The quantified analytical data will be exported from the instruments and compiled with the corresponding sample data.
  7. The test results are organized and reviewed by the lab personnel.
  8. The finalized test results are reported in a compliant format and released to the client.

In order to ensure that cannabis testing laboratories function reliably, they are obliged to follow and execute certain organizational and regulatory protocols throughout the testing process. These involve critical factors that determine the accuracy of testing services of a laboratory.

Factors Critical to a Cannabis Testing Laboratory 

  • Accreditations & Regulatory Compliance: Cannabis testing laboratories are subject to regulatory compliance requirements, accreditation standards, laboratory practices and policies at the state level. A standard that most cannabis testing labs comply to is ISO 17025, which sets the requirements of quality standards in testing laboratories. Accreditation to this standard represents the determination of competence by an independent third party referred to as the “Accreditation Body”. Accreditation ensures that laboratories are adhering to their methods. These testing facilities have mandatory participation in proficiency tests regularly in order to maintain accreditation.
  • Quality Assurance, Standards & Proficiency Testing: Quality assurance is in part achieved by implementing standard test methods that have been thoroughly validated. When standard methods are not available, the laboratory must validate their own methods. In addition to using valid and appropriate methods, accredited laboratories are also required to participate in appropriate and commercially available Proficiency Test Program or Inter-Laboratory Comparison Study. Both PT and ILC Programs provide laboratories with some measure of their analytic performance and compare that performance with other participating laboratories.

    Multi-analyte Configuration for Cannabis Testing Services
    CloudLIMS Cannabis Testing LIMS: Multi-analyte Configuration for Cannabis Testing Services
  • Real-time Collaboration: Testing facilities generate metadata such as data derived from cannabis samples and infused products. The testing status and test results are best served for compliance and accessibility when integrated and stored on a centralized platform. This helps in timely data sharing and facilitates informed decision making, effective cooperation and relationships between cannabis testing facilities and growers. This platform is imperative for laboratories that have grown to high volume throughput where opportunities for errors exist. By matching test results to samples, this platform ensures consistent sample tracking and traceability. Finally, the platform is designed to provide immediate, real-time reporting to individual state or other regulatory bodies.
  • Personnel Management: Skilled scientific staff in cannabis-testing laboratories are required to oversee testing activities. Staff should have experience in analytical chromatography instruments such as HPLC and GC-MS. Since samples are often used for multi-analytes such as terpenes, cannabinoids, pesticides etc., the process often involves transferring samples and tests from one person to another within the testing facility. A chain of custody (CoC) is required to ensure traceability and ‘ownership’ for each person involved in the workflow.

LIMS for Laboratory Automation

Gathering, organizing and controlling laboratory-testing data can be time-consuming, labor-intensive and challenging for cannabis testing laboratories. Using spreadsheets and paper methods for this purpose is error-prone, makes data retrieval difficult and does not allow laboratories to easily adhere to regulatory guidelines. Manual systems are cumbersome, costly and lack efficiency. One way to meet this challenge is to switch to automated solutions that eliminate many of the mundane tasks that utilize valuable human resources.. Laboratory automation transforms the data management processes and as a result, improves the quality of services and provides faster turnaround time with significant cost savings. Automating the data management protocol will improve the quality of accountability, improve technical efficiency, and improve fiscal resources.

cloudlims screenshot
Real Time Test Status in CloudLIMS

A Laboratory Information Management System (LIMS) is a software tool for testing labs that aids efficient data management. A LIMS organizes, manages and communicates all laboratory test data and related information, such as sample and associated metadata, tests, Standard Operating Procedures (SOPs), test reports, and invoices. It also enables fully automated data exchange between instruments such as HPLCs, GC-FIDs, etc. to one consolidated location, thereby reducing transcription errors.

How LIMS Helps Cannabis Testing Labs

LIMS are much more capable than spreadsheets and paper-based tools for streamlining the analytical and operational lab activities and enhances the productivity and quality by eliminating manual data entry. Cloud-enabled LIMS systems such as CloudLIMS are often low in the total cost of acquisition, do not require IT staff and are scalable to help meet the ever changing business and regulatory compliance needs. Some of the key benefits of LIMS for automating a cannabis-testing laboratory are illustrated below [Table 1]:

Key Functionality Benefit
Barcode label designing and printing Enables proper labelling of samples and inventory

Follows GLP guidelines

Instant data capture by scanning barcodes Facilitates quick client registration and sample access
3600 data traceability Saves time and resources for locating samples and other records
Inventory and order management Supports proactive planning/budgeting and real time accuracy
Custodian management Promotes overall laboratory organization by assigning custodians for samples and tests

Maintains the Chain-of-custody (CoC)

Test management Accommodates pre-loaded test protocols to quickly assign tests for incoming samples
Accounting for sample and inventory quantity Automatically deducts sample and inventory quantities when consumed in tests
Package & shipment management Manages incoming samples and samples that have been subcontracted to other laboratories
Electronic data import Electronically imports test results and metadata from integrated instruments

Eliminates manual typographical errors

Report management Generates accurate, customizable, meaningful and test reports for clients

Allows user to include signatures and additional sections for professional use

21 CFR Part 11 compliant Authenticates laboratory activities with electronic signatures
ISO 17025 accreditation Provides traceable documentary evidence required to achieve ISO 17025 accreditation
Audit trail capabilities Adheres to regulatory standards by recording comprehensive audit logs for laboratory activities along with the date and time stamp
Centralized data management Stores all the data in a single, secure database facilitating quick data retrieval
Workflow management Promotes better data management and resource allocation
High-configurability Enables modification of screens using graphical configuration tools to mirror testing workflows
State compliance systems Integrates with state-required compliance reporting systems and communicates using API
Adheres to regulatory compliance Creates Certificates of Analysis (CoA) to prove regulatory compliance for each batch as well as batch-by-batch variance analysis and other reports as needed.
Data security & confidentiality Masks sensitive data from unauthorized user access


Cloud-based LIMS encrypts data at rest and in-transit while transmission between the client and the server

Global accessibility Cloud-based LIMS provides real-time access to laboratory data from anytime anywhere
Real-time collaboration Cloud-based LIMS enhances real-time communication within a laboratory, between a laboratory and its clients, and across a global organization with multiple sites

Table 1. Key functionality and benefits of LIMS for cannabis testing laboratories

Upon mapping the present day challenges faced by cannabis testing laboratories, adopting laboratory automation solutions becomes imperative. Cloud-based LIMS becomes a valuable tool for laboratory data management in cannabis testing laboratories. In addition to reducing manual workloads, and efficient resource management, it helps labs focus on productive lab operations while achieving compliance and regulatory goals with ease.

For more information on this, check out a webinar here: Webinar: How to Meet Cannabis Testing Standards and Regulatory Requirements with LIMS by Stephen Goldman, laboratory director at the State of Colorado certified Cannabis testing facility, PhytaTech.

Quality Assurance In The Field: Instruments For Growers & Processors

By Aaron G. Biros
2 Comments

As the cannabis marketplace evolves, so does the technology. Cultivators are scaling up their production and commercial-scale operations are focusing more on quality. That greater attention to detail is leading growers, extractors and infused product manufacturers to use analytical chemistry as a quality control tool.

Previously, using analytical instrumentation, like mass spectrometry (MS) or gas chromatography (GC), required experience in the laboratory or with chromatography, a degree in chemistry or a deep understanding of analytical chemistry. This leaves the testing component to those that are competent enough and scientifically capable to use these complex instruments, like laboratory personnel, and that is still the case. As recent as less than two years ago, we began seeing instrument manufacturers making marketing claims that their instrument requires no experience in chromatography.

Instrument manufacturers are now competing in a new market: the instrument designed for quality assurance in the field. These instruments are more compact, lighter and easier to use than their counterparts in the lab. While they are no replacement for an accredited laboratory, manufacturers promise these instruments can give growers an accurate estimate for cannabinoid percentages. Let’s take a look at a few of these instruments designed and marketed for quality assurance in the field, specifically for cannabis producers.

Ellutia GC 200 Series

Shamanics, a cannabis extractor in Amsterdam, uses Ellutia’s 200 series for QA testing

Ellutia is an instrument manufacturer from the UK. They design and produce a range of gas chromatographs, GC accessories, software and consumables, most of which are designed for use in a laboratory. Andrew James, marketing director at Ellutia, says their instrument targeting this segment was originally designed for educational purposes. “The GC is compact in size and lightweight in stature with a full range of detectors,” says James. “This means not only is it portable and easy to access but also easy to use, which is why it was initially intended for the education market.”

Andrew James, marketing director at Ellutia

That original design for use in teaching, James says, is why cannabis producers might find it so user-friendly. “It offers equivalent performance to other GC’s meaning we can easily replace other GC’s performing the same analysis, but our customers can benefit from the lower space requirement, reduced energy bills, service costs and initial capital outlay,” says James. “This ensures the lowest possible cost of ownership, decreasing the cost per analysis and increasing profits on every sample analyzed.”

Shamanics, a cannabis oil extraction company based in Amsterdam, uses Ellutia’s 200 series for quality assurance in their products. According to Bart Roelfsema, co-founder of Shamanics, they have experienced a range of improvements in monitoring quality since they started using the 200 series. “It is very liberating to actually see what you are doing,” says Roelfsema. “If you are a grower, a manufacturer or a seller, it is always reassuring to see what you have and prove or improve on your quality.” Although testing isn’t commonplace in the Netherlands quite yet, the consumer demand is rising for tested products. “We also conduct terpene analysis and cannabinoid acid analysis,” says Roelfsema. “This is a very important aspect of the GC as now it is possible to methylate the sample and test for acids; and the 200 Series is very accurate, which is a huge benefit.” Roelfsema says being able to judge quality product and then relay that information to retail is helping them grow their business and stay ahead of the curve.

908 Devices G908 GC-HPMS

908 Devices, headquartered in Boston, is making a big splash in this new market with their modular G908 GC-HPMS. The company says they are “democratizing chemical analysis by way of mass spectrometry,” with their G908 device. That is a bold claim, but rather appropriate, given that MS used to be reserved strictly for the lab environment. According to Graham Shelver, Ph.D., commercial leader for Applied Markets at 908 Devices Inc., their company is making GC-HPMS readily available to users wanting to test cannabis products, who do not need to be trained analytical chemists.

The G908 device.

Shelver says they have made the hardware modular, letting the user service the device themselves. This, accompanied by simplified software, means you don’t need a Ph.D. to use it. “The “analyzer in a box” design philosophy behind the G908 GC-HPMS and the accompanying JetStream software has been to make using the entire system as straightforward as possible so that routine tasks such as mass axis calibration are reduced to simple single actions and sample injection to results reporting becomes a single button software operation,” says Shelver.

He also says while it is designed for use in the field, laboratories also use it to meet higher-than-usual demand. Both RM3 Labs in Colorado, and ProVerde in Massachusetts, use G908. “RM3’s main goal with the G908 is increased throughput and ProVerde has found it useful in adding an orthogonal and very rapid technique (GC-HPMS) to their suite of cannabis testing instruments,” says Shelver.

Orange Photonics LightLab Cannabis Analyzer

Orange Photonics’ LightLab Cannabis Analyzer

Dylan Wilks, a third generation spectroscopist, launched Orange Photonics with his team to produce analytical tools that are easy to use and can make data accessible where it has been historically absent, such as onsite testing within the cannabis space. According to Stephanie McArdle, president of Orange Photonics, the LightLab Cannabis Analyzer is based on the same principles as HPLC technology, combining liquid chromatography with spectroscopy. Unlike an HPLC however, LightLab is rugged, portable and they claim you do not need to be a chemist to use it.

“LightLab was developed to deliver accurate repeatable results for six primary cannabinoids, D9THC, THC-A, CBD, CBD-A, CBG-A and CBN,” says McArdle. “The sample prep is straightforward: Prepare a homogenous, representative sample, place a measured portion in the provided vial, introduce extraction solvent, input the sample into LightLab and eight minutes later you will have your potency information.” She says their goal is to ensure producers can get lab-grade results.

The hard plastic case is a unique feature of this instrument

McArdle also says the device is designed to test a wide range of samples, allowing growers, processors and infused product manufacturers to use it for quality assurance. “Extracts manufacturers use LightLab to limit loss- they accurately value trim purchases on the spot, they test throughout their extraction process including tests on spent material (raffinate) and of course the final product,” says McArdle. “Edibles manufacturers test the potency of their raw ingredients and check batch dosing. Cultivators use LightLab for strain selection, maturation monitoring, harvesting at peak and tinkering.”

Orange Photonics’ instrument also connects to devices via Wi-Fi and Bluetooth. McArdle says cannabis companies throughout the supply chain use it. “We aren’t trying to replace lab testing, but anyone making a cannabis product is shooting in the dark if they don’t have access to real time data about potency,” says McArdle.

The Practical Chemist

Instrumentation Used for Terpene Analysis

By Tim Herring
2 Comments

Terpenes are a group of volatile, unsaturated hydrocarbons found in the essential oils of plants. They are responsible for the characteristic smells and flavors of most plants, such as conifers, citrus, as well as cannabis. Over 140 terpenes have been identified to date and these unique compounds may have medicinal properties. Caryophyllene, for example, emits a sweet, woody, clove taste and is believed to relieve inflammation and produce a neuroprotective effect through CB2 receptor activation. Limonene has a citrus scent and may possess anti-cancer, anti-bacterial, anti-fungal and anti-depression effects. Pinene is responsible for the pine aroma and acts as a bronchodilator. One theory involving terpenes is the Entourage Effect, a synergistic benefit from the combination of cannabinoids and terpenes.

Many customers ask technical service which instrumentation is best, GC or HPLC, for analysis of terpenes. Terpenes are most amenable to GC, due to their inherent volatility. HPLC is generally not recommended; since terpenes have very low UV or MS sensitivity; the cannabinoids (which are present in percent levels) will often interfere or coelute with many of the terpenes.

Figure 1: Terpene profile via headspace, courtesy of ProVerde Laboratories.

Headspace (HS), Solid Phase Microextraction of Headspace (HS-SPME) or Split/Splitless Injection (SSI) are viable techniques and have advantages and disadvantages. While SPME can be performed by either direct immersion with the sample or headspace sampling, HS-SPME is considered the most effective technique since this approach eliminates the complex oil matrix. Likewise, conventional HS also targets volatiles that include the terpenes, leaving the high molecular weight oils and cannabinoids behind (Figure 1). SSI eliminates the complexity of a HS or SPME concentrator/autosampler, however, sensitivity and column lifetime become limiting factors to high throughput, since the entire sample is introduced to the inlet and ultimately the column.

The GC capillary columns range from thicker film, mid-polarity (Rxi-624sil MS for instance) to thinner film, non-polar 100% polysiloxane-based phases, such as an Rxi-1ms. A thicker film provides the best resolution among the highly volatile, early eluting compounds, such as pinene. Heavier molecular weight compounds, such as the cannabinoids, are difficult to bake off of the mid-polarity phases. A thinner, non-polar film enables the heavier terpenes and cannabinoids to elute efficiently and produces sharp peaks. Conversely the early eluting terpenes will often coelute using a thin film column. Columns that do not contain cyano-functional groups (Rxi-624Sil MS), are more robust and have higher temperature limits and lower bleed.

For the GC detector, a Mass Spectrometer (MS) can be used, however, many of the terpenes are isobars, sharing the same ions used for identification and quantification. Selectivity is the best solution, regardless of the detector. The Flame Ionization Detector (FID) is less expensive to purchase and operate and has a greater dynamic range, though it is not as sensitive, nor selective for coeluting impurities.

By accurately and reproducibly quantifying terpenes, cannabis medicines can be better characterized and controlled. Strains, which may exhibit specific medical and psychological traits, can be identified and utilized to their potential. The lab objectives, customer expectations, state regulations, available instrumentation, and qualified lab personnel will ultimately determine how the terpenes will be analyzed.

Chris English
The Practical Chemist

Accurate Detection of Residual Solvents in Cannabis Concentrates

By Chris English
2 Comments
Chris English

Edibles and vape pens are rapidly becoming a sizable portion of the cannabis industry as various methods of consumption popularize beyond just smoking dried flower. These products are produced using cannabis concentrates, which come in the form of oils, waxes or shatter (figure 1). Once the cannabinoids and terpenes are removed from the plant material using solvents, the solvent is evaporated leaving behind the product. Extraction solvents are difficult to remove in the low percent range so the final product is tested to ensure leftover solvents are at safe levels. While carbon dioxide and butane are most commonly used, consumer concern over other more toxic residual solvents has led to regulation of acceptable limits. For instance, in Colorado the Department of Public Health and Environment (CDPHE) updated the state’s acceptable limits of residual solvents on January 1st, 2017.

Headspace Analysis

Figure 1: Shatter can be melted and dissolved in a high molecular weight solvent for headspace analysis (HS). Photo Courtesy of Cal-Green Solutions.

Since the most suitable solvents are volatile, these compounds are not amenable to HPLC methods and are best suited to gas chromatography (GC) using a thick stationary phase capable of adequate retention and resolution of butanes from other target compounds. Headspace (HS) is the most common analytical technique for efficiently removing the residual solvents from the complex cannabis extract matrix. Concentrates are weighed out into a headspace vial and are dissolved in a high molecular weight solvent such as dimethylformamide (DMF) or 1,3-dimethyl-3-imidazolidinone (DMI). The sealed headspace vial is heated until a stable equilibrium between the gas phase and the liquid phase occurs inside the vial. One milliliter of gas is transferred from the vial to the gas chromatograph for analysis. Another approach is full evaporation technique (FET), which involves a small amount of sample sealed in a headspace vial creating a single-phase gas system. More work is required to validate this technique as a quantitative method.

Gas Chromatographic Detectors

The flame ionization detector (FID) is selective because it only responds to materials that ionize in an air/hydrogen flame, however, this condition covers a broad range of compounds. When an organic compound enters the flame; the large increase in ions produced is measured as a positive signal. Since the response is proportional to the number of carbon atoms introduced into the flame, an FID is considered a quantitative counter of carbon atoms burned. There are a variety of advantages to using this detector such as, ease of use, stability, and the largest linear dynamic range of the commonly available GC detectors. The FID covers a calibration of nearly 5 orders of magnitude. FIDs are inexpensive to purchase and to operate. Maintenance is generally no more complex than changing jets and ensuring proper gas flows to the detector. Because of the stability of this detector internal standards are not required and sensitivity is adequate for meeting the acceptable reporting limits. However, FID is unable to confirm compounds and identification is only based on retention time. Early eluting analytes have a higher probability of interferences from matrix (Figure 2).

Figure 2: Resolution of early eluting compounds by headspace – flame ionization detection (HS-FID). Chromatogram Courtesy of Trace Analytics.

Mass Spectrometry (MS) provides unique spectral information for accurately identifying components eluting from the capillary column. As a compound exits the column it collides with high-energy electrons destabilizing the valence shell electrons of the analyte and it is broken into structurally significant charged fragments. These fragments are separated by their mass-to-charge ratios in the analyzer to produce a spectral pattern unique to the compound. To confirm the identity of the compound the spectral fingerprint is matched to a library of known spectra. Using the spectral patterns the appropriate masses for quantification can be chosen. Compounds with higher molecular weight fragments are easier to detect and identify for instance benzene (m/z 78), toluene (m/z 91) and the xylenes (m/z 106), whereas low mass fragments such as propane (m/z 29), methanol (m/z 31) and butane (m/z 43) are more difficult and may elute with matrix that matches these ions. Several disadvantages of mass spectrometers are the cost of equipment, cost to operate and complexity. In addition, these detectors are less stable and require an internal standard and have a limited dynamic range, which can lead to compound saturation.

Regardless of your method of detection, optimized HS and GC conditions are essential to properly resolve your target analytes and achieve the required detection limits. While MS may differentiate overlapping peaks the chances of interference of low molecular weight fragments necessitates resolution of target analytes chromatographically. FID requires excellent resolution for accurate identification and quantification.

The Practical Chemist

Pesticide Analysis in Cannabis and Related Products: Part 3

By Julie Kowalski
No Comments

As mentioned in Part 1, pesticides residue analysis is very challenging especially considering the complexity of cannabis and the variety of flower, concentrates and infused products. In addition, pesticides are tested at low levels typically at parts-per-billion (ppb). For example, the food safety industry often uses 10 ppb as a benchmark limit of quantification. To put that in perspective, current pesticides limits in cannabis range from 10 ppb default (Massachusetts Regulatory Limit) to a more typical range of 100 ppb to 2 ppm in other states. Current testing is also complicated by evolving regulations.

Despite these challenges, adaptation of methods used by the food safety industry have proved successful for testing pesticides in cannabis. These methods typically rely on mass spectrometric detection paired with sample preparation methods to render the sample clean enough to yield quality data.

Pesticide Analysis Methods: Sample preparation and Analytical Technique Strategy

Generally, methods can be divided into two parts; sample preparation and analytical testing where both are critical to the success of pesticide residue testing and are inextricably linked. Reliance on mass spectrometric techniques like tandem mass spectrometry and high resolution accurate mass (HRAM) mass spectrometry is attributed to the substantial sensitivity and selectivity provided. The sensitivity and selectivity achievable by the detector largely dictates the sample preparation that will be required. The more sensitive and selective the detector, the less rigorous and resource intensive sample preparation can be.

Analytical technique: Gas and Liquid Chromatography Tandem Mass Spectrometry 

The workhorse approach for pesticide residue analysis involves using gas chromatography and liquid chromatography tandem mass spectrometry (MS/MS) in the ion transition mode. This ion transition mode, often referred to as multiple reaction monitoring (MRM) or selected reaction monitoring (SRM), adds the selectivity and sensitivity needed for trace level analysis. Essentially, a pesticide precursor ion is fragmented into product ions. The detector monitors the signal for a specified product ion known to have originated from the pesticide precursor ion. This allows the signal to be corrected, associated with the analyte and not with other matrix components in the sample. In addition, because only ions meeting the precursor/product ion requirements are passed to the detector with little noise, there is a benefit to the observed signal to noise ratio allowing better sensitivity than in other modes. Even though ion transitions are specific, there is the possibility a matrix interference that also demonstrates that same ion transition could result in a false positive. Multiple ion transitions for each analyte are monitored to determine an ion ratio. The ion ratio should remain consistent for a specific analyte and is used to add confidence to analyte identification.

The best choice for pesticide analysis between gas chromatography (GC) and liquid chromatography (LC) is often questioned. To perform comprehensive pesticide screening similar to the way the food safety market approaches this challenge requires both techniques. It is not uncommon for screening methods to test for several hundred pesticides that vary in physiochemical properties. It may be possible that with a smaller list of analytes, only one technique will be needed but often in order to reach the low limits for pesticide residues both GC and LC are required.

Modified QuEChERS extraction using 1.5 grams of cannabis flower. Courtesy of Julie Kowalski (Restek Corporation), Jeff Dahl (Shimadzu Scientific Instruments) and Derek Laine (Trace Analytics).

Analytical technique: Sample Preparation

Less extensive sample preparation is possible when combined with sensitive and selective detectors like MS/MS. One popular method is the QuEChERS approach. QuEChERS stands for Quick, Easy, Cheap, Effective, Rugged and Safe. It consists of a solvent extraction/salting out step followed by a cleanup using dispersive solid phase extraction. Originally designed for fruit and vegetable pesticide testing, QuEChERS has been modified and used for many other commodity types including cannabis. Although QuEChERS is a viable method, sometimes more cleanup is needed and this can be done with cartridge solid phase extraction. This cleanup functions differently and is more labor intensive, but results in a cleaner extract. A cleaner extract helps to secure quality data and is sometimes needed for difficult analyses.

The Practical Chemist

Potency Analysis of Cannabis and Derivative Products: Part 2

By Rebecca Stevens
3 Comments

As mentioned in Part 1, the physiological effects of cannabis are mediated by a group of structurally related organic compounds known as cannabinoids. The cannabinoids are biosynthetically produced by a growing cannabis plant and Figure 1 details the biosynthetic pathways leading to some of the most important cannabinoids in plant material.

Potency figure 1
Figure 1: The biosynthetic pathway of phytocannabinoid production in cannabis has been deeply studied through isotopic labeling experiments

The analytical measurement of cannabinoids is important to ensure the safety and quality of cannabis as well as its extracts and edible formulations. Total cannabinoid levels can vary significantly between different cultivars and batches, from about 5% up to 20% or more by dry weight. Information on cannabinoid profiles can be used to tailor cultivars for specific effects and allows end users to select an appropriate dose.

Routine Analysis vs. Cannabinomics 

Several structurally analogous groups of cannabinoids exist. In total, structures have been assigned for more than 70 unique phytocannabinoids as of 2005 and the burgeoning field of cannabinomics seeks to comprehensively measure these compounds.¹

Considering practical potency analysis, the vast majority of cannabinoid content is accounted for by 10-12 compounds. These include Δ9-tetrahydrocannabinol (THC), cannabidiol (CBD), cannabigerol (CBG), Δ9-tetrahydrocannabivarian (THCV), cannabidivarin (CBDV) and their respective carboxylic acid forms. The cannabinoids occur primarily as carboxylic acids in plant material. Decarboxylation occurs when heat is applied through smoking, vaporization or cooking thereby producing neutral cannabinoids which are more physiologically active.

Potency Analysis by HPLC and GC

Currently, HPLC and GC are the two most commonly used techniques for potency analysis. In the case of GC, the heat used to vaporize the injected sample causes decarboxylation of the native cannabinoid acids. Derivatization of the acids may help reduce decarboxylation but overall this adds another layer of complexity to the analysis² ³. HPLC is the method of choice for direct analysis of cannabinoid profiles and this technique will be discussed further.

A sample preparation method consisting of grinding/homogenization and alcohol extraction is commonly used for cannabis flower and extracts. It has been shown to provide good recovery and precision² ³. An aliquot of the resulting extract can then be diluted with an HPLC compatible solvent such as 25% water / 75% acetonitrile with 0.1% formic acid. The cannabinoids are not particularly water soluble and can precipitate if the aqueous percentage is too high.

To avoid peak distortion and shifting retention times the diluent and initial mobile phase composition should be reasonably well matched. Another approach is to make a smaller injection (1-2 µL) of a more dissimilar solvent. The addition of formic acid or ammonium formate buffer acidifies the mobile phase and keeps the cannabinoid acids protonated.

The protonated acids are neutral and thus well retained on a C18 type column, even at higher (~50% or greater) concentrations of organic solvent² ³.

Detection is most often done using UV absorbance. Two main types of UV detectors are available for HPLC, single wavelength and diode array. A diode array detector (DAD) measures absorbance across a range of wavelengths producing a spectrum at each point in a chromatogram while single wavelength detectors only monitor absorbance at a single user selected wavelength. The DAD is more expensive, but very useful for detecting coelutions and interferences.

References

  1. Chemical Constituents of Marijuana: The Complex Mixture of Natural Cannabinoids. Life Sciences, 78, (2005), pp. 539
  2. Development and Validation of a Reliable and Robust Method for the Analysis of Cannabinoids and Terpenes in Cannabis. Journal of AOAC International, 98, (2015), pp. 1503
  3. Innovative Development and Validation of an HPLC/DAD Method for the Qualitative and Quantitative Determination of Major Cannabinoids in Cannabis Plant Material. Journal of Chromatography B, 877, (2009), pp. 4115

Rebecca is an Applications Scientist at Restek Corporation and is eager to field any questions or comments on cannabis analysis, she can be reached by e-mail, rebecca.stevens@restek.com or by phone at 814-353-1300 (ext. 2154)

The Practical Chemist

Appropriate Instrumentation for the Chemical Analysis of Cannabis and Derivative Products: Part 1

By Rebecca Stevens
1 Comment

Election Day 2016 resulted in historic gains for state level cannabis prohibition reform. Voters in California, Maine, Massachusetts and Nevada chose to legalize adult use of Cannabis sp. and its extracts while even traditionally conservative states like Arkansas, Florida, Montana and North Dakota enacted policy allowing for medical use. More than half of the United States now allows for some form of legal cannabis use, highlighting the rapidly growing need for high quality analytical testing.

For the uninitiated, analytical instrumentation can be a confusing mix of abbreviations and hyphenation that provides little obvious information about an instrument’s capability, advantages and disadvantages. In this series of articles, my colleagues and I at Restek will break down and explain in practical terms what instruments are appropriate for a particular analysis and what to consider when choosing an instrumental technique.

Potency Analysis

Potency analysis refers to the quantitation of the major cannabinoids present in Cannabis sp. These compounds are known to provide the physiological effects of cannabis and their levels can vary dramatically based on cultivation practices, product storage conditions and extraction practices.

The primary technique is high performance liquid chromatography (HPLC) coupled to ultraviolet absorbance (UV) detection. Gas chromatography (GC) coupled to a flame ionization detector (FID) or mass spectrometry (MS) can provide potency information but suffers from issues that preclude its use for comprehensive analysis.

Pesticide Residue Analysis

Pesticide residue analysis is, by a wide margin, the most technically challenging testing that we will discuss here. Trace levels of pesticides incurred during cultivation can be transferred to the consumer both on dried plant material and in extracts prepared from the contaminated material. These compounds can be acutely toxic and are generally regulated at part per billion parts-per-billion levels (PPB).

Depending on the desired target pesticides and detection limits, HPLC and/or GC coupled with tandem mass spectrometry (MS/MS) or high resolution accurate mass spectrometry (HRAM) is strongly recommended. Tandem and HRAM mass spectrometry instrumentation is expensive, but in this case it is crucial and will save untold frustration during method development.

Residual Solvents Analysis

When extracts are produced from plant material using organic solvents such as butane, alcohols or supercritical carbon dioxide there is a potential for the solvent and any other contaminants present in it to become trapped in the extract. The goal of residual solvent analysis is to detect and quantify solvents that may remain in the finished extract.

Residual solvent analysis is best accomplished using GC coupled to a headspace sample introduction system (HS-GC) along with FID or MS detection. Solid phase microextraction (SPME) of the sample headspace with direct introduction to the GC is another option.

Terpene Profile Analysis

While terpene profiles are not a safety issue, they provide much of the smell and taste experience of cannabis and are postulated to synergize with the physiologically active components. Breeders of Cannabis sp. are often interested in producing strains with specific terpene profiles through selective breeding techniques.

Both GC and HPLC can be employed successfully for terpenes analysis. Mass spectrometry is suitable for detection as well as GC-FID and HPLC-UV.

Heavy Metals Analysis

Metals such as arsenic, lead, cadmium, chromium and mercury can be present in cannabis plant material due to uptake from the soil, fertilizers or hydroponic media by a growing plant. Rapidly growing plants like Cannabis sp. are particularly efficient at extracting and accumulating metals from their environment.

Several different types of instrumentation can be used for metals analysis, but the dominant technology is inductively coupled plasma mass spectrometry (ICP-MS). Other approaches can also be used including ICP coupled with optical emission spectroscopy (ICP-OES).

Rebecca is an Applications Scientist at Restek Corporation and is eager to field any questions or comments on cannabis analysis, she can be reached by e-mail, rebecca.stevens@restek.com or by phone at 814-353-1300 (ext. 2154)

An inductively coupled plasma torch used in MS reaches local temperatures rivaling the surface of the sun. Image by W. Blanchard, Wikimedia
An inductively coupled plasma torch used in Optical Emission Spectroscopy (OES) reaches local temperatures rivaling the surface of the sun. Image by W. Blanchard, Wikimedia
The Practical Chemist

Building the Foundation of Medical Cannabis Testing – Understanding the Use of Standards and Reference Materials – Part 2

By Joe Konschnik
No Comments

In the last article I referred to the analogy of the analytical reference material being a keystone of the laboratory foundation, the stone upon which all data relies. I then described the types of reference materials and their use in analytical testing in general terms. This article will describe the steps required to properly manufacture and deliver a certified reference material (CRM) along with the necessary documentation.

A CRM is an exclusive reference material that meets strict criteria defined by ISO Guide 34 and ISO/IEC 17025.  ISO is the International Organization for Standardization and IEC is the International Electrotechnical Commission. These organizations work together to set globally recognized standards. In order for a reference material to be labeled as a CRM it must 1) be made with raw or starting materials which are characterized using qualified methods and instruments, 2) be produced in an ISO-accredited lab under documented procedures, and 3) fall under the manufacturer’s scopes of accreditation. Verifying a CRM supplier has these credentials is easily done by viewing their certificates which should include their scopes of accreditation. Restek_accredit

There are many steps required to produce a CRM that meets the above three criteria.  The first step requires a review of the customer’s, or end-user’s requirements to carefully define what is to be tested, at what levels and which analytical workflow will be used.  Such information enables the producer to identify the proper compounds and solvents required to properly formulate the requested CRM.

The next step requires sourcing and acquiring the raw, or starting materials, then verifying their compatibility and stability using stability and shipping studies in accordance with ISO requirements. Next the chemical identify and purity of the raw materials must be characterized using one or more analytical techniques such as: GC-FID, HPLC, GC-ECD, GC-MS, LC-MS, refractive index and melting point. In some cases, the percent purity is changed by the producer when their testing verifies it’s different from the supplier label. All steps are of course documented.

restek_CRMThe producer’s analytical balances must be verified using NIST traceable weights and calibrated annually by an accredited third party provider to guarantee accurate measurement. CRMs must be prepared using Class A volumetric glassware, and all ampules and vials used in preparation and final packaging must be chemically treated to prevent compound degradation during storage. Next, CRMs are packaged in an appropriate container, labeled then properly stored to maintain the quality and stability until it’s ready to be shipped. All labels must include critical storage, safety and shelf life information to meet federal requirements. The label information must be properly linked to documentation commonly referred to as a certificate of analysis (COA) which describes all of the above steps and verifies the traceability and uncertainty of all measurements for each compound contained in the CRM. Restek_CRM2

My company, RESTEK, offers a variety of documentation choices to accompany each CRM. Depending on the intended use and data quality objectives specified by the end-user, which were defined way back at the first step, three options are typically offered: They include gravimetric only, qualitative which includes gravimetric, and fully quantitative which includes all three levels of documentation. The graphic to the right summarizes the three options and what they include.

It’s important to understand which level you’re purchasing especially when ordering a custom CRM from a supplier. Most stock CRMs include all three levels of documentation, but it’s important to be sure.

Understanding what must be done to produce and deliver a CRM sets it apart from other reference material types, however it’s important to understand there are some instances where CRMs are either not available, nor required and in those situations other types of reference materials are perfectly acceptable.

If you have any questions or would like more details about reference materials please contact me, Joe Konschnik at (800) 356-1688 ext. 2002 by phone, or email me at joe.konschnik@restek.com.

The Practical Chemist

Building the Foundation of Medical Cannabis Testing – Understanding the Use of Standards and Reference Materials – Part 1

By Joe Konschnik
No Comments

In previous articles, you may recall that Amanda Rigdon, one our contributing authors, stated that instrument calibration is the foundation of all data quality. In this article, I would like to expand on that salient point. A properly calibrated instrument will, in fact, produce reliable data. It is the foundation we build our data upon. All foundations are comprised of building blocks, and our laboratory is no exception. If we take this analogy further, the keystone to the laboratory foundation, the stone that all data relies upon, is the analytical reference material. Proper calibration means that it is based on a true, accurate value. That is what the reference material provides. In this article, I would like to expand on the use and types of reference materials in analytical testing.

To develop sound analytical data, it is important to understand the significance of reference materials and how they are properly used. The proper selection and use of reference materials ensures the analytical certainty, traceability and comparability necessary to produce scientifically sound data. First, let’s take a moment to define the types of commonly used reference materials. According to the International Vocabulary of Metrology (VIM), a Reference Standard (RS) is something that is reused to measure against, like a balance or a set of weights. A Reference Material (RM) is a generic term. It is described as something that is prepared using a RS that is homogeneous, stable and is consumed during its use for measurement. An example of an RM is the solutions used to construct a calibration curve, often referred to as calibration standards, on your GC or LC. Due to the current state of cannabis testing, reference materials can be hard to find and, even more critical, variable in their accuracy to a known reference standard. Sometimes this is not critical, but when quantifying an unknown, it is paramount.

RMs can be either quantitative or qualitative. Qualitative RMs verify the identity and purity of a compound. Quantitative RMs, on the other hand, provide a known concentration, or mass, telling us not only what is present, and its purity, but also how much. This is typically documented on the certificate that accompanies the reference material, which is provided by the producer or manufacturer. The certificate describes all of the properties of the starting materials and steps taken to prepare the RM. For testing requirements, like potency, pesticides, etc., where quantitation is expected, it is important to use properly certified quantitative RMs.

Now, the pinnacle of reference materials is the Certified Reference Material (CRM). VIM defines a Certified Reference Material (CRM) as an RM accompanied by documentation issued by an authoritative body and provides one or more specified property values, with associated uncertainties and traceability using valid procedures. A CRM is generally recognized as providing the highest level of traceability and accuracy to a measurement – the strongest keystone you can get for your foundation. It is also important to recognize that the existence of a certificate does not make a reference material a CRM. It is the process used in manufacturing that makes it a CRM, and these are typically accreditations earned by specific manufacturers who have invested on this level of detail.

Now that we understand the types of reference materials we can choose, in the next article of this series we will describe what a CRM provider must do to ensure the material and how we can use them to develop reliable data. Without properly formulated and prepared CRMs, instrument calibration and the use of internal standards are less effective at ensuring the quality of your data.


If you have any questions please contact me, Joe Konschnik at (800) 356-1688 ext. 2002 by phone, or email me at joe.konschnik@restek.com.