
In May, the National Cannabis Industry Association (NCIA) announced a partnership with BDS Analytics, a cannabis market intelligence and data firm, according to a press release. Beginning in June of this year, NCIA members received access to market and sales data via BDS Analytics’ GreenEdge sales tracking software.![]()
![]() According to Aaron Smith, executive director of NCIA, market intelligence was previously very scarce in the emerging cannabis industry. “We hear from our members all the time that one of their biggest challenges is the scarcity of reliable market intelligence and data in the industry,” says Smith. “Being able to offer this kind of data as an included benefit of NCIA membership is incredibly valuable. We’re proud to partner with BDS and grateful for their support of NCIA’s mission.”
According to Aaron Smith, executive director of NCIA, market intelligence was previously very scarce in the emerging cannabis industry. “We hear from our members all the time that one of their biggest challenges is the scarcity of reliable market intelligence and data in the industry,” says Smith. “Being able to offer this kind of data as an included benefit of NCIA membership is incredibly valuable. We’re proud to partner with BDS and grateful for their support of NCIA’s mission.”

The GreenEdge reports span numerous product categories as well as high-level market reporting. According to Roy Bingham, chief executive officer of BDS Analytics, NCIA member-businesses can take part in a tutorial to familiarize them with the interface. Bingham says they have extraordinarily comprehensive data on Colorado and Washington; they will have Oregon’s data ready in less than three months and roll out nationally to all major markets during the rest of 2016 and 2017.
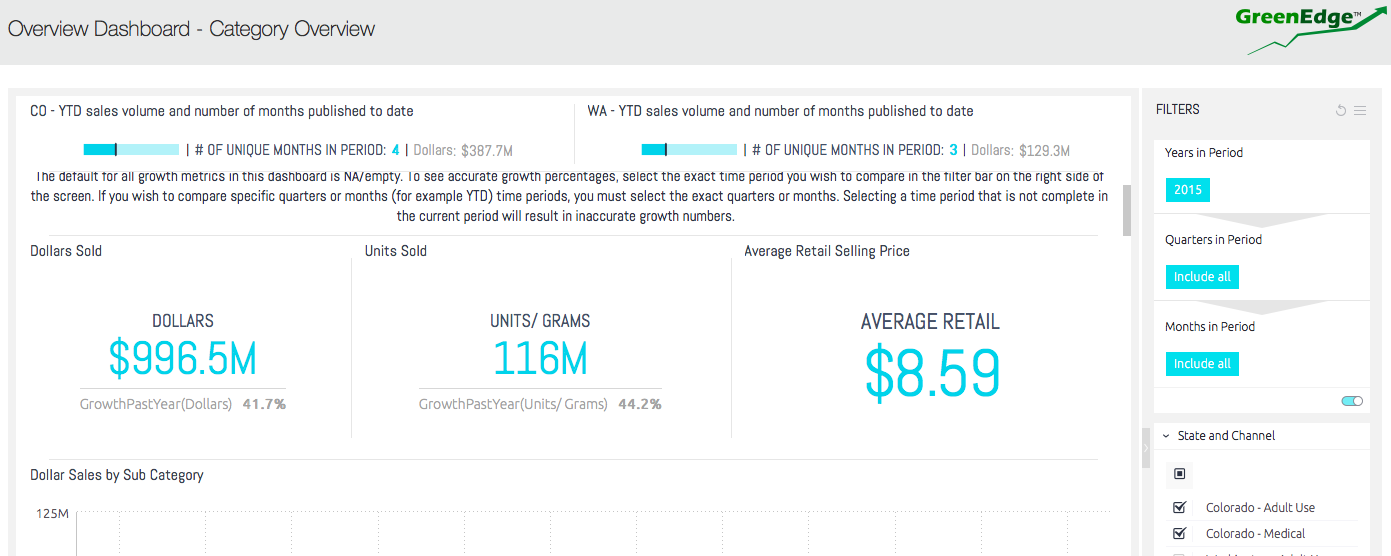
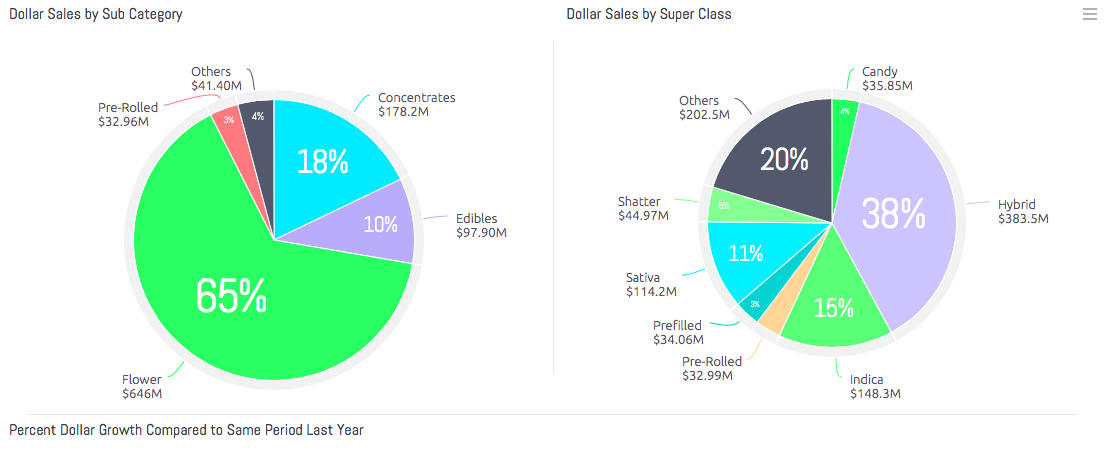
Through using the interactive GreenEdge reports, we were able to identify key market figures and growth percentages, such as percent of the market share held by dry flower, average infused chocolate bar prices and much more. We found that Colorado’s recreational and medical markets totaled $996.5 million in 2015, just shy of a billion dollars. 28% of that market was held by infused products and concentrates, which grew by 111% over the previous twelve months. The average infused chocolate bar sold at retail in Colorado was priced at $14.47 last year. Overall, Colorado’s cannabis marketplace grew by over 41% between 2014 and 2015.
 According to Bingham, for most mature industries, a ten percent transaction value of the market is sufficient to scale data so that it speaks to the entire market. “However, this is not a stable, mature industry so we are more comfortable with a sample size of around twenty percent of the total market,” says Bingham. “We are well over those numbers in Colorado and Washington.” In order to get the data, BDS Analytics makes direct arrangements with dispensaries on their panel to get access to their point-of-sale data, which can be done in almost real time or in a download at the end of each month. “It is then standardized with a learning software system, assisted by personnel, that gets better over time at categorizing data points,” says Bingham. “We use algorithms to scale the data to the total industry size, and there are a number of adjustments made to those algorithms to make sure the data is normalized.” The program has recorded more than 20 million transactions to date.
 Dispensaries provide their data because they get the full service that comes with being a member of the panel, including details down to the brand level, according to Bingham. “This enables dispensaries to offer consumers what they are purchasing on average in their market,” says Bingham. “You get to see a breakdown of the most popular brands and items if you join the panel and submit data.” They have categorized more than 20,000 unique products, such as a number of different types of concentrates, different types of infused products and more.
The interactive data tool holds tremendous value for NCIA members and business owners in the cannabis space, giving them access to market data previously unavailable or difficult to find.